Free Power BI templates
Power BI dashboard templates
Short answer
Where can I get free Power BI templates with sample data?
These 61 dashboard templates download free as PBIP projects, and every one includes a sample semantic model with bound visuals (beta), so the page shows numbers after one refresh in Power BI Desktop. Each template also comes as a background image and a theme JSON, and the licence covers client and commercial reports.
61 templates
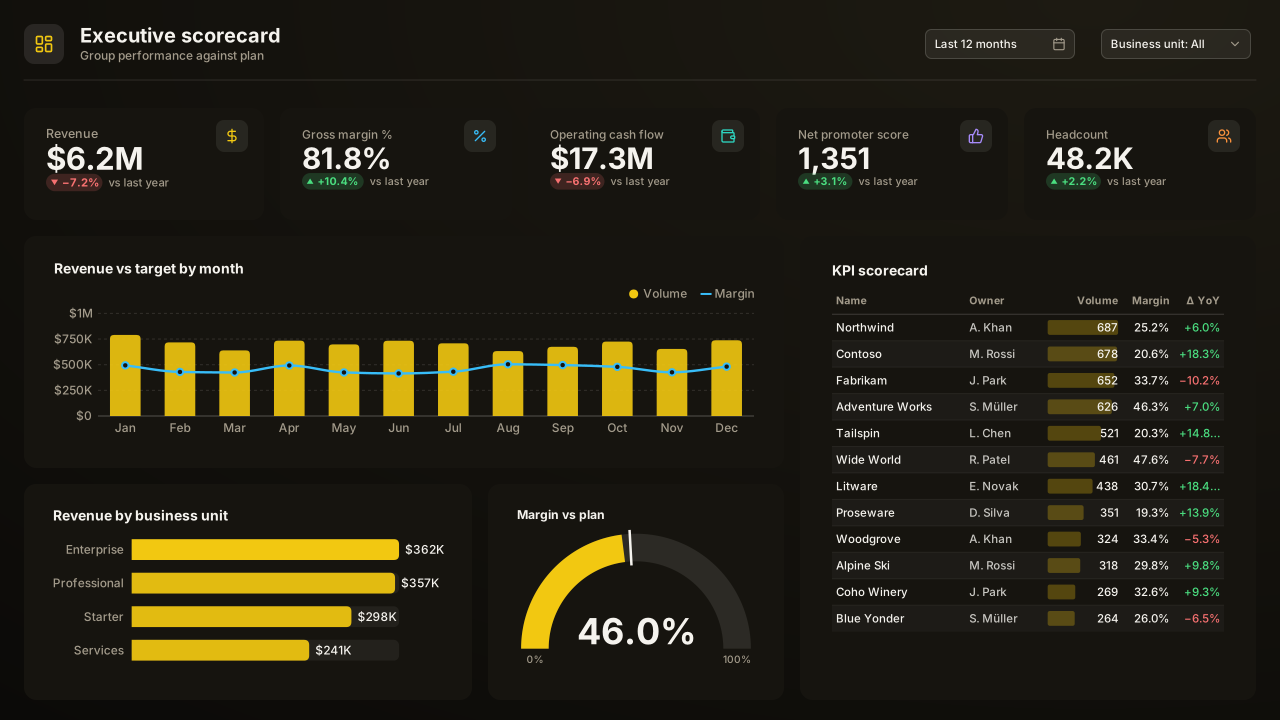 Executive
 KPI Scorecard
Plain header with two slicers, 5 KPI cards, trend + scorecard splitVizForge InkFree for commercial use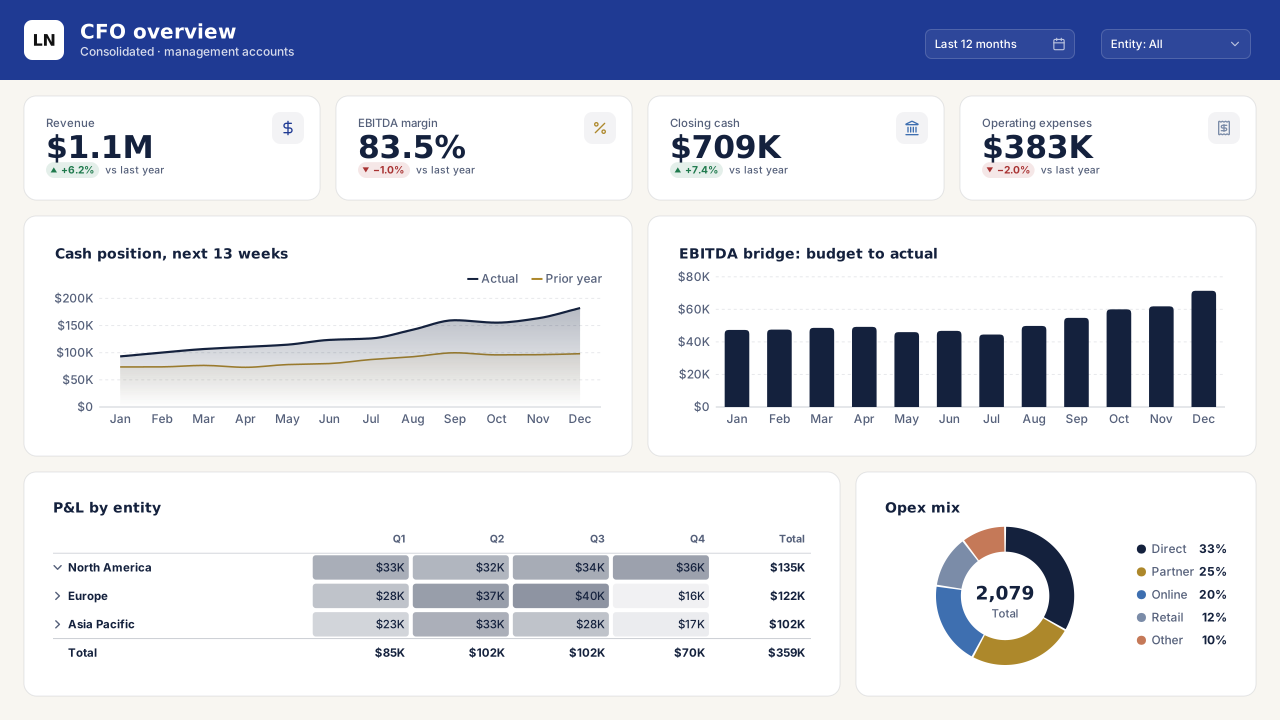 Finance
CFO Overview
Navy header band with logo and slicers, 4 KPIs, 2 rows of paired panelsLedger NavyFree for commercial use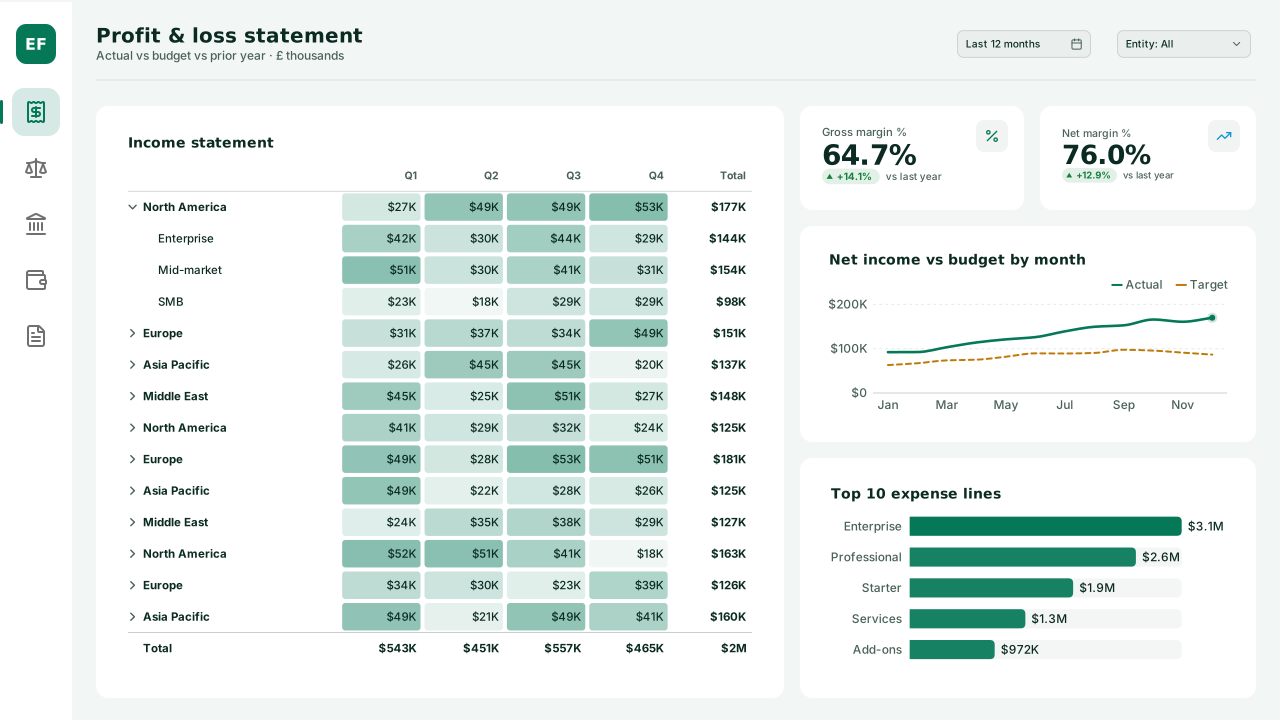 Finance
Profit & Loss Statement
Left nav rail, full-height matrix, KPI pair and two supporting chartsEmerald FinanceFree for commercial use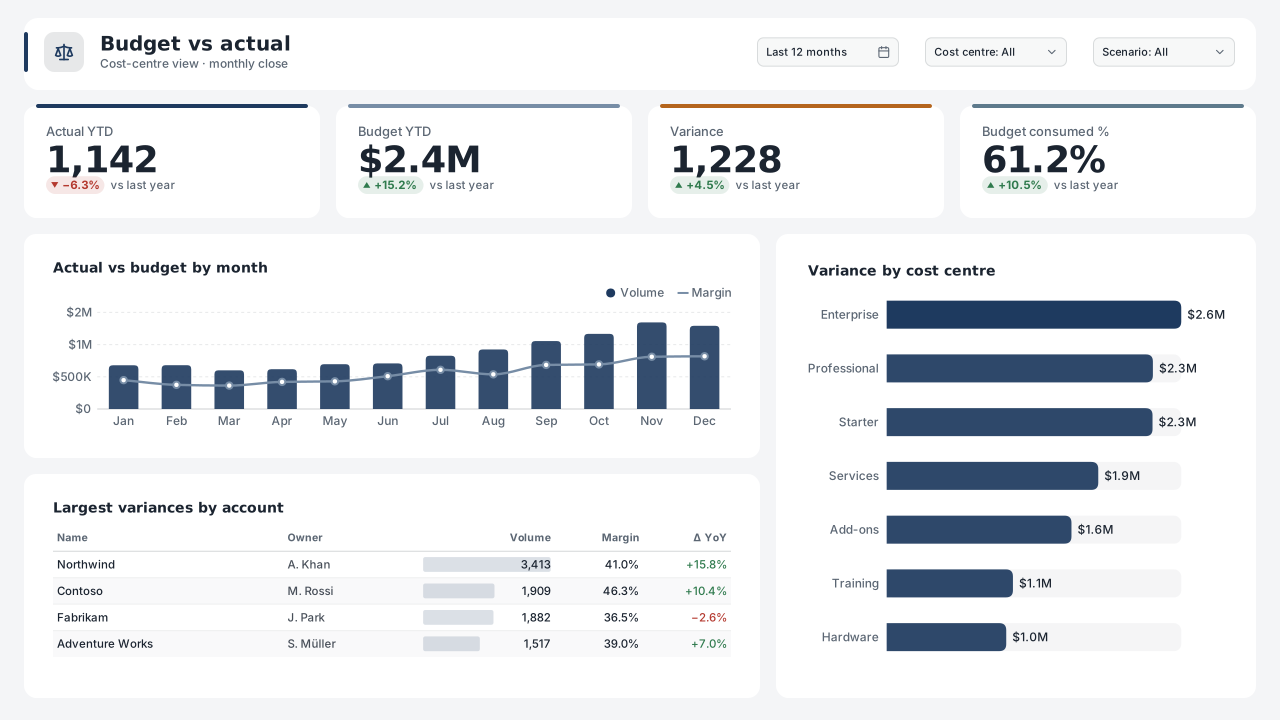 Finance
Budget vs Actual
Floating header card with 3 slicers, 4 striped KPIs, combo + table + ranked barsSlate ExecutiveFree for commercial use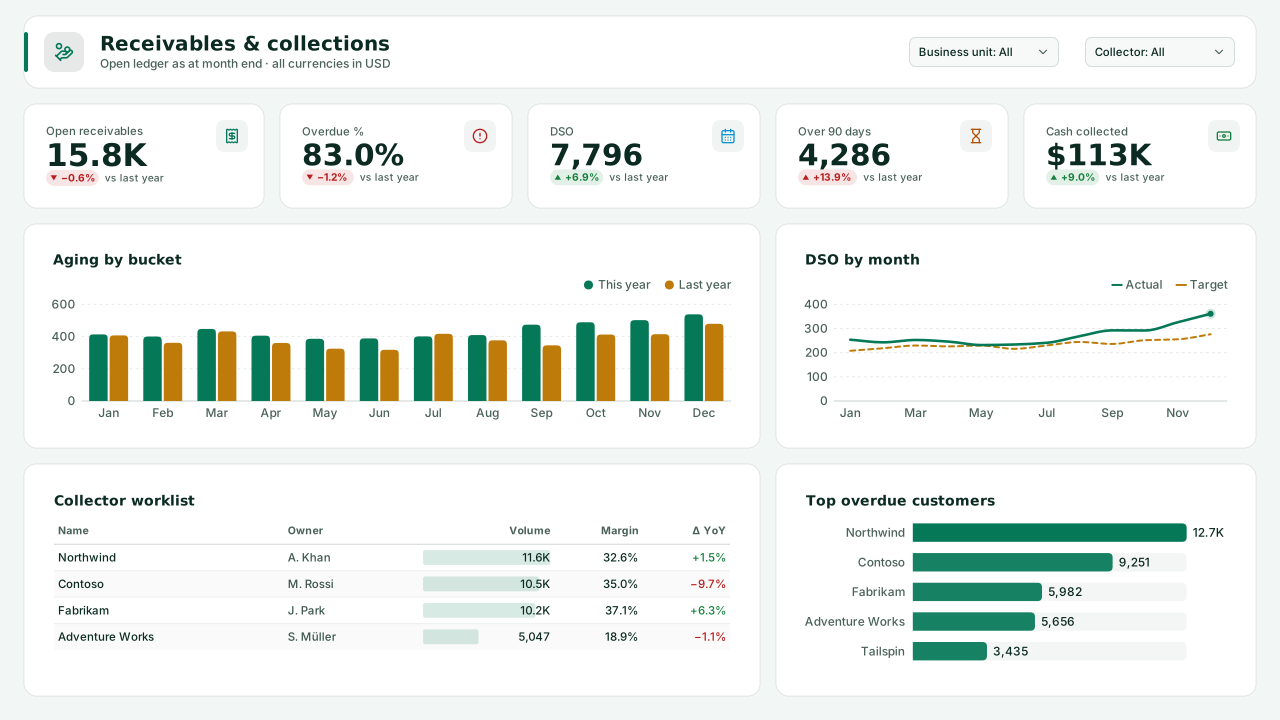 Finance
Accounts Receivable & Collections
Flat header card with 2 slicers, 5 KPIs, aging buckets + DSO trend, collector worklist + overdue customersEmerald FinanceFree for commercial use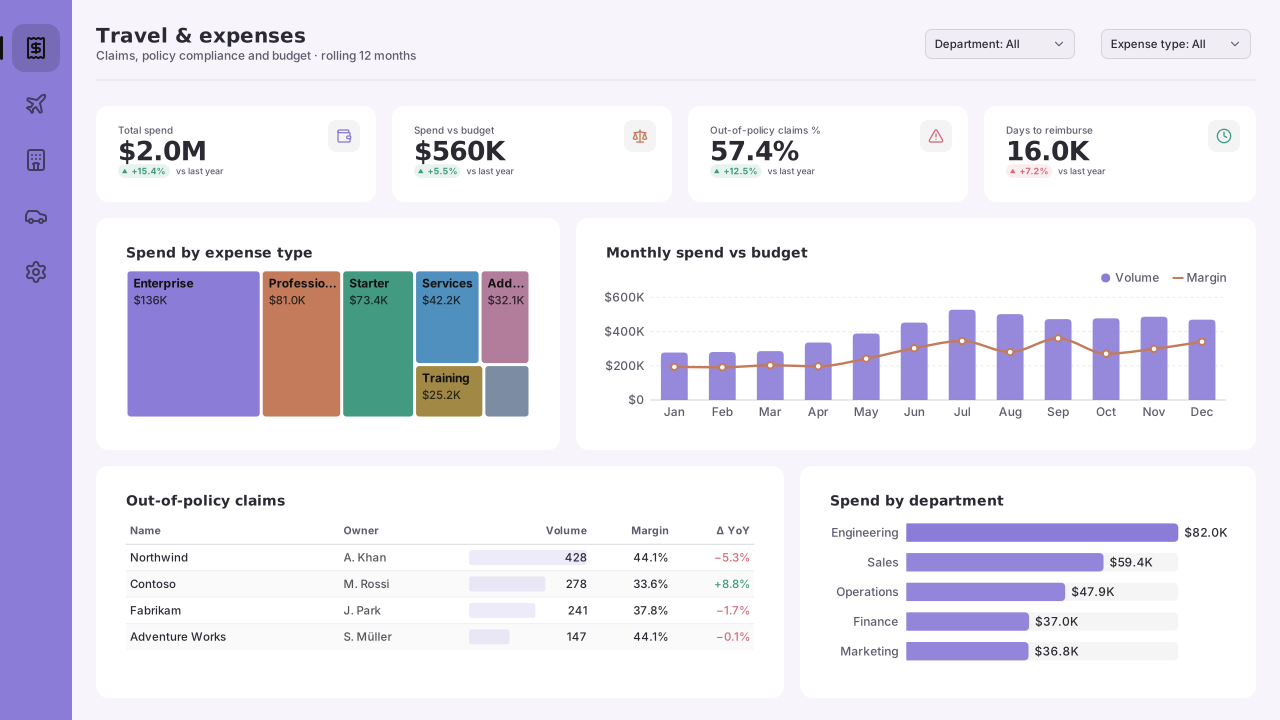 Finance
Travel & Expense Management
Left nav rail, 4 KPIs, expense-type treemap + spend vs budget combo, out-of-policy table + department barsPastel StudioFree for commercial use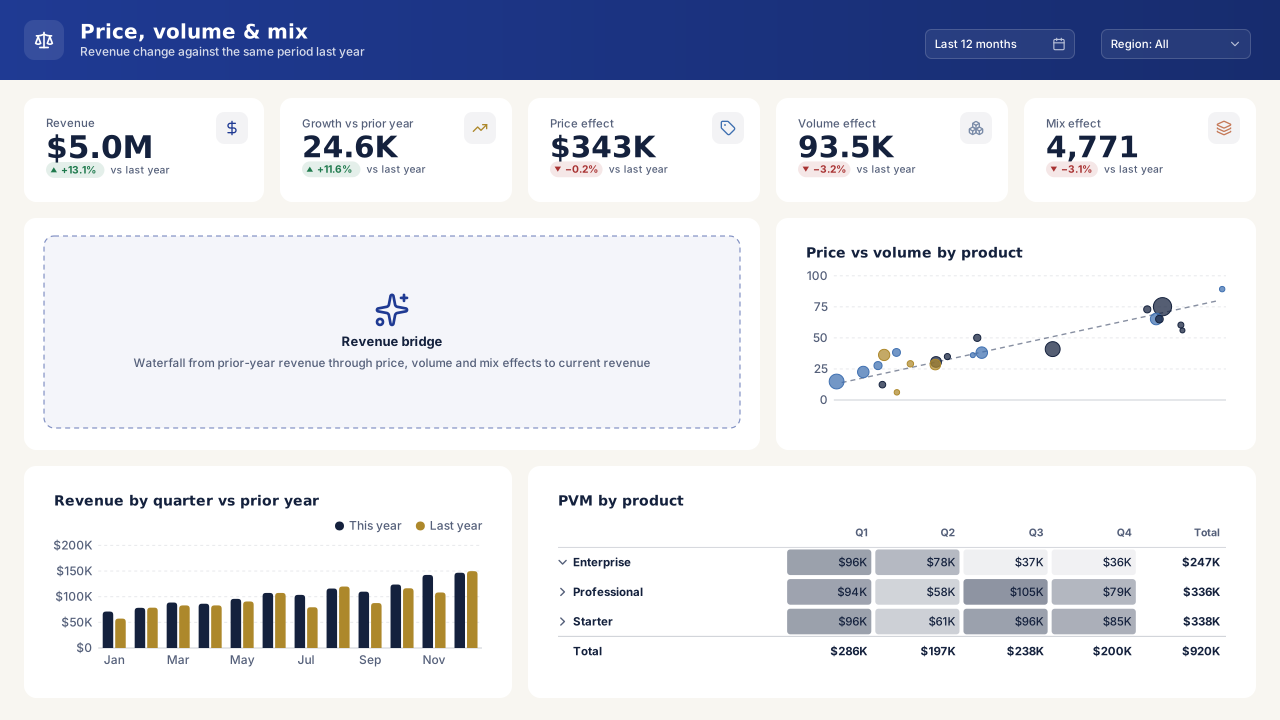 Finance
Price-Volume-Mix Analysis
Gradient band header, 5 KPIs, revenue-bridge slot + price/volume scatter, quarterly comparison + PVM matrixLedger NavyFree for commercial use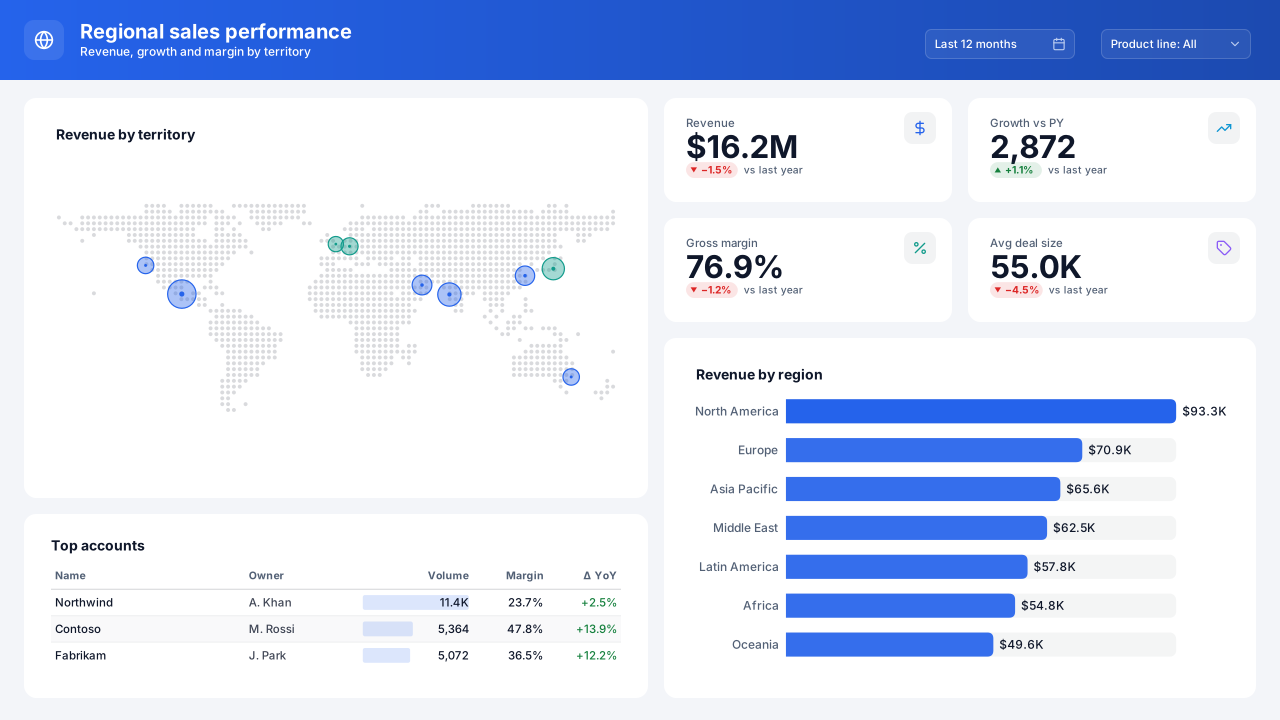 Sales
Regional Sales Performance
Gradient header band, large map left, 2×2 KPIs and ranked bars right, accounts tableBoardroom BlueFree for commercial use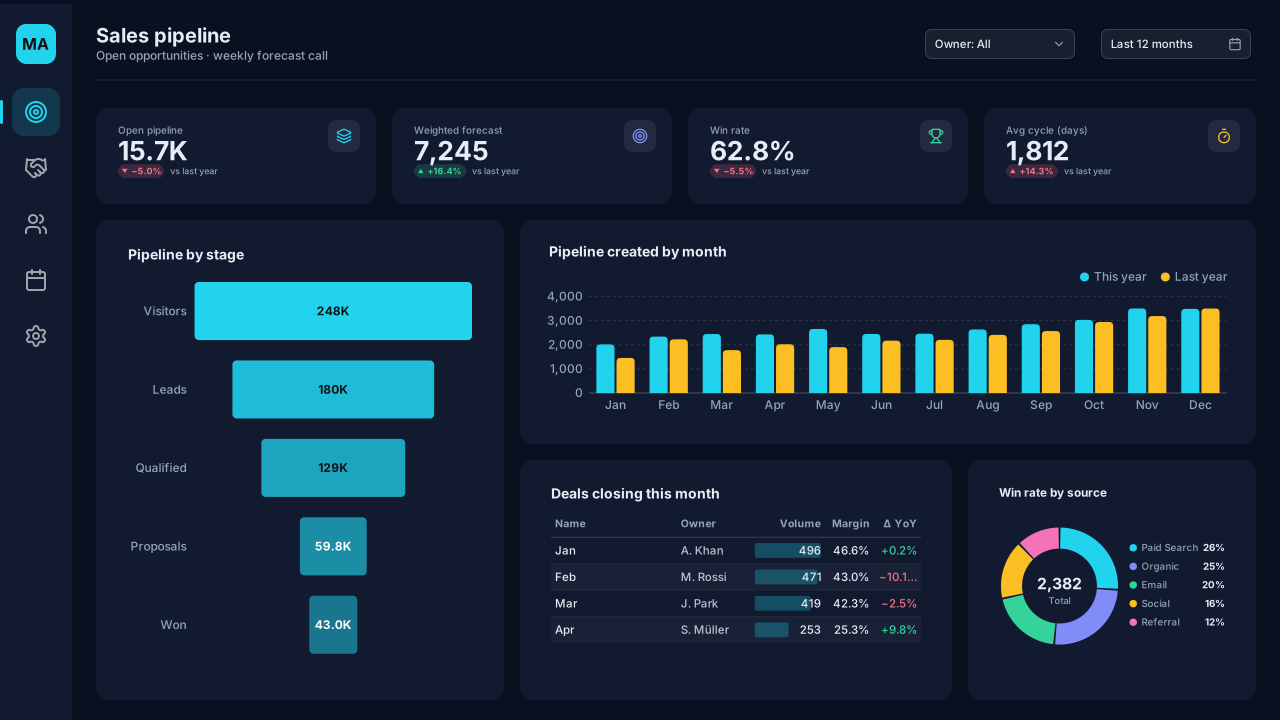 Sales
Sales Pipeline
Left nav rail, 4 KPIs, full-height funnel, trend over table and donutMidnight AnalyticsFree for commercial use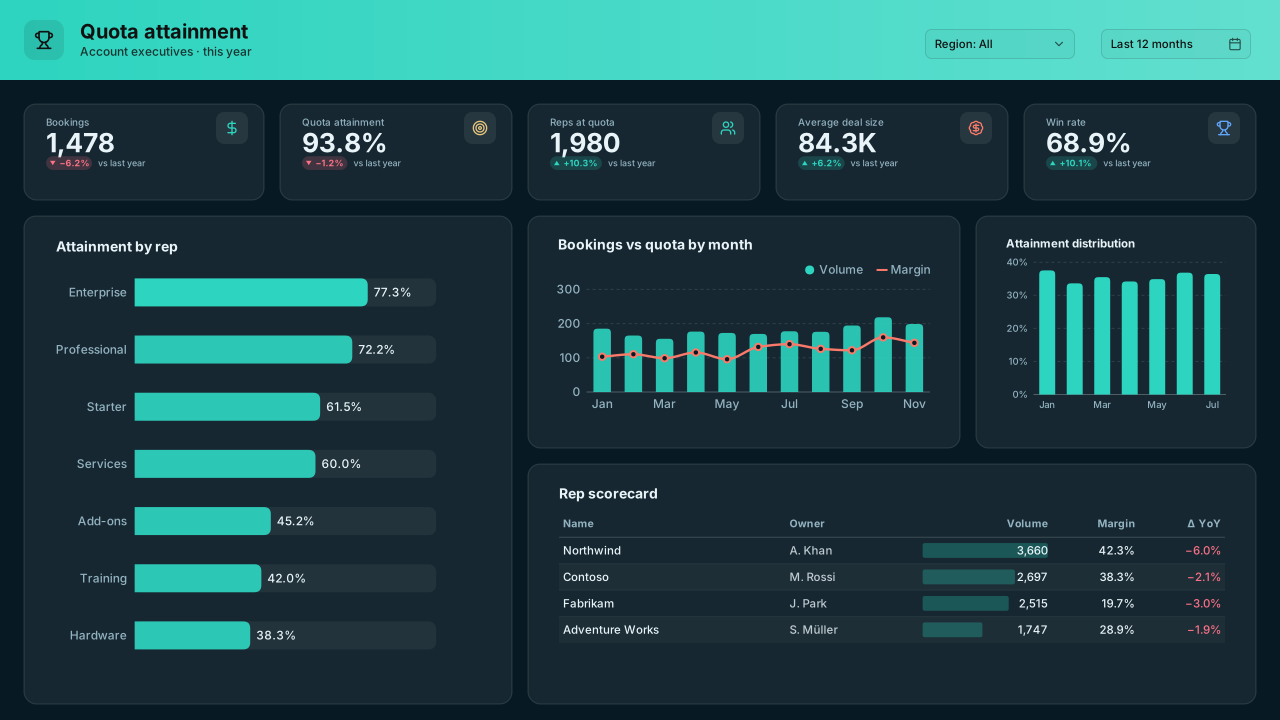 Sales
Sales Rep Quota Attainment
Gradient band header, 5 KPIs, full-height rep leaderboard left, quota combo + distribution columns + scorecard rightOcean DeepFree for commercial use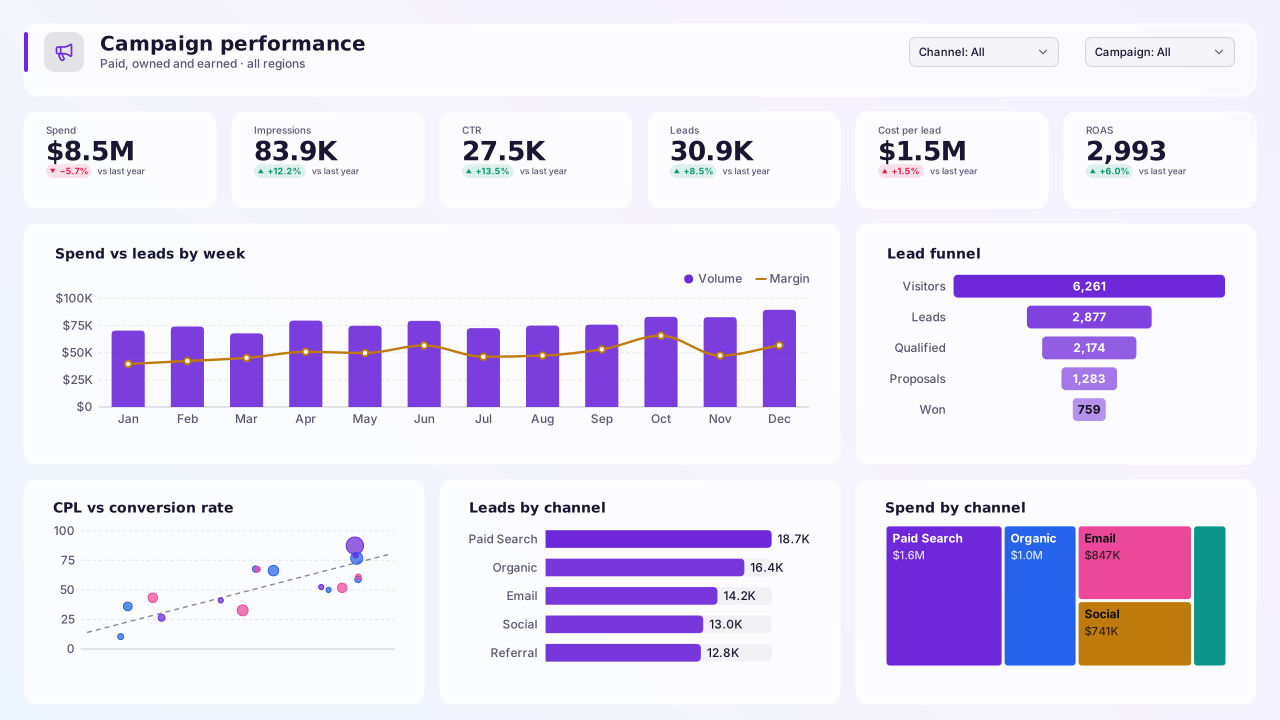 Marketing
 Campaign Performance
Glass header card, 6 compact KPIs, trend + funnel, three channel panelsLavender SaaSFree for commercial use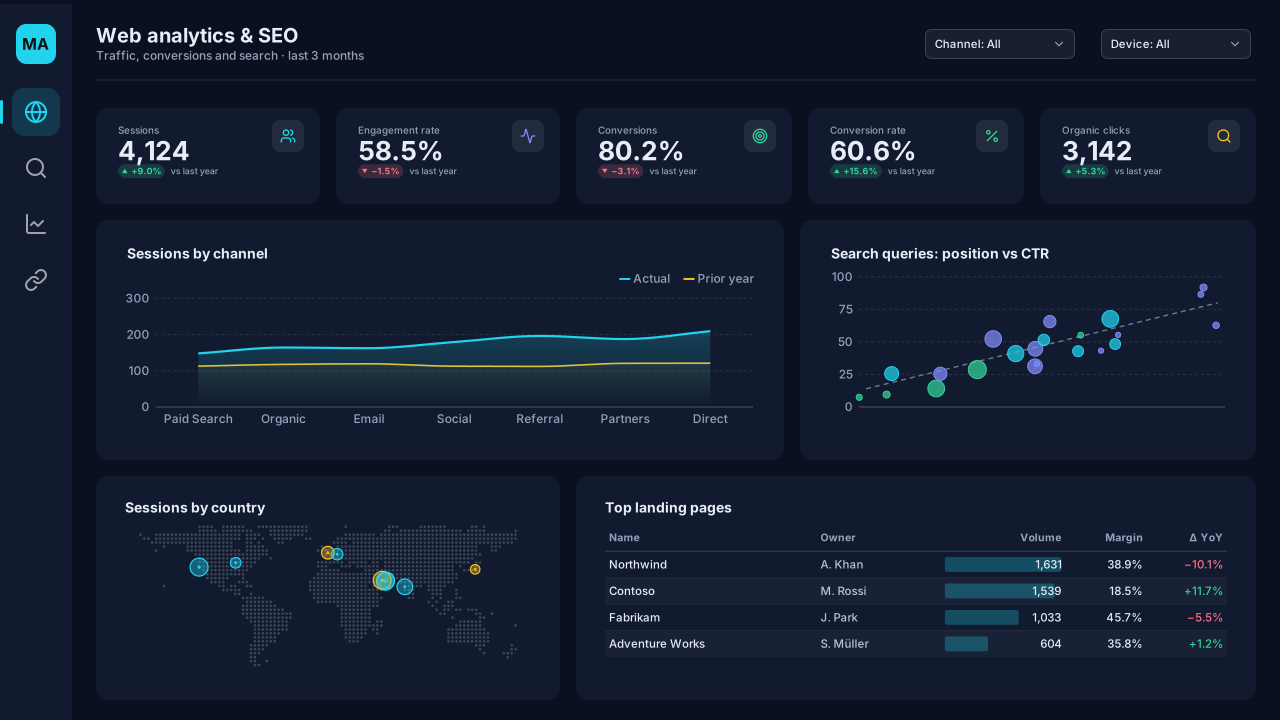 Marketing
Web Analytics & SEO
Left nav rail, 5 KPIs, channel area + query scatter, country map + landing-page tableMidnight AnalyticsFree for commercial use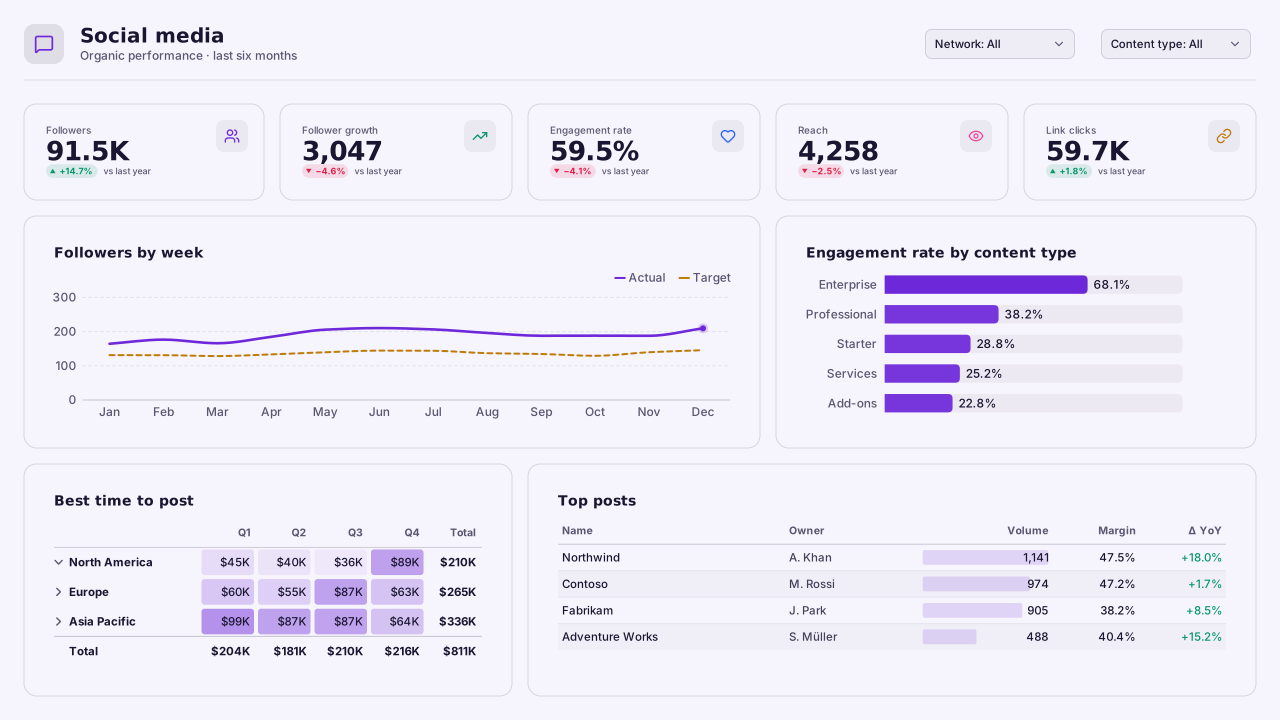 Marketing
Social Media Performance
Plain header, 5 outline KPIs, follower lines + content-type bars, day × time heatmap + top-posts tableLavender SaaSFree for commercial use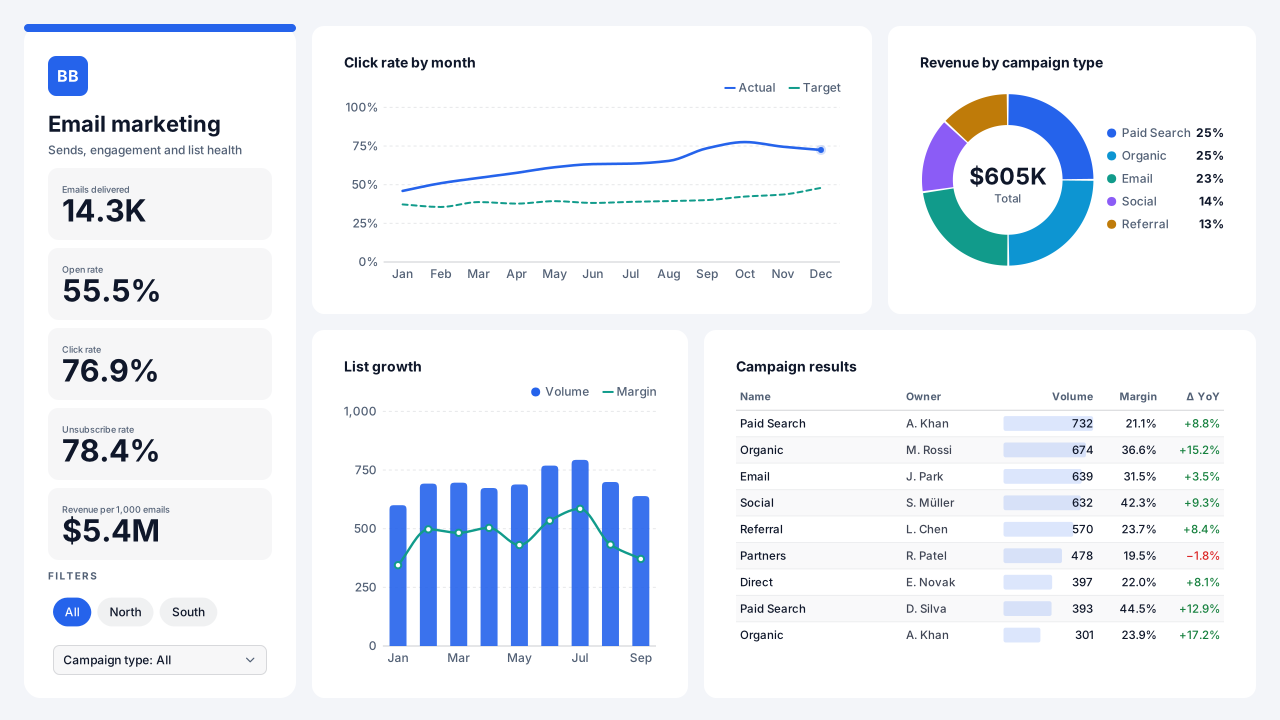 Marketing
Email Marketing
Side panel with 5 stacked KPIs and slicers, click-rate trend + revenue donut, list-growth combo + campaign tableBoardroom BlueFree for commercial use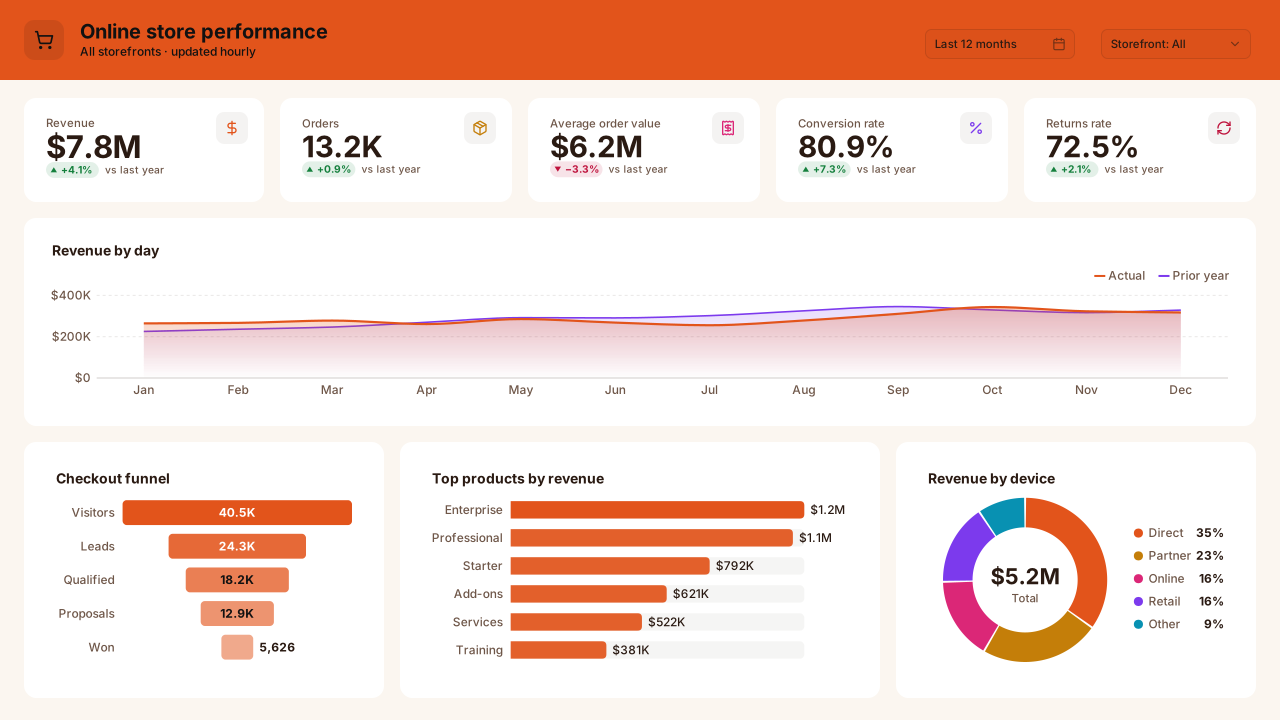 Retail & e-commerce
E-commerce Performance
Header band, 5 icon KPIs, full-width daily trend, three-panel bottom rowSunset RetailFree for commercial use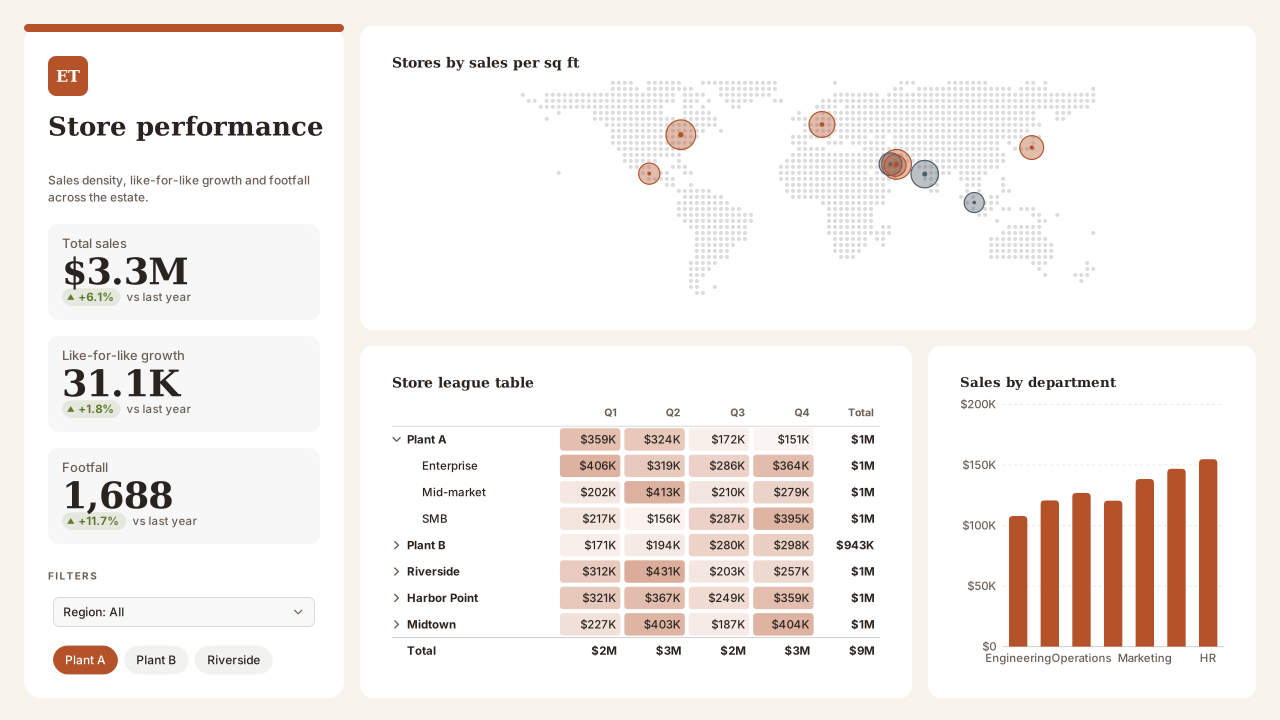 Retail & e-commerce
Retail Store Performance
Left story panel with stacked KPIs and slicers, map over league table and barsEarth TonesFree for commercial use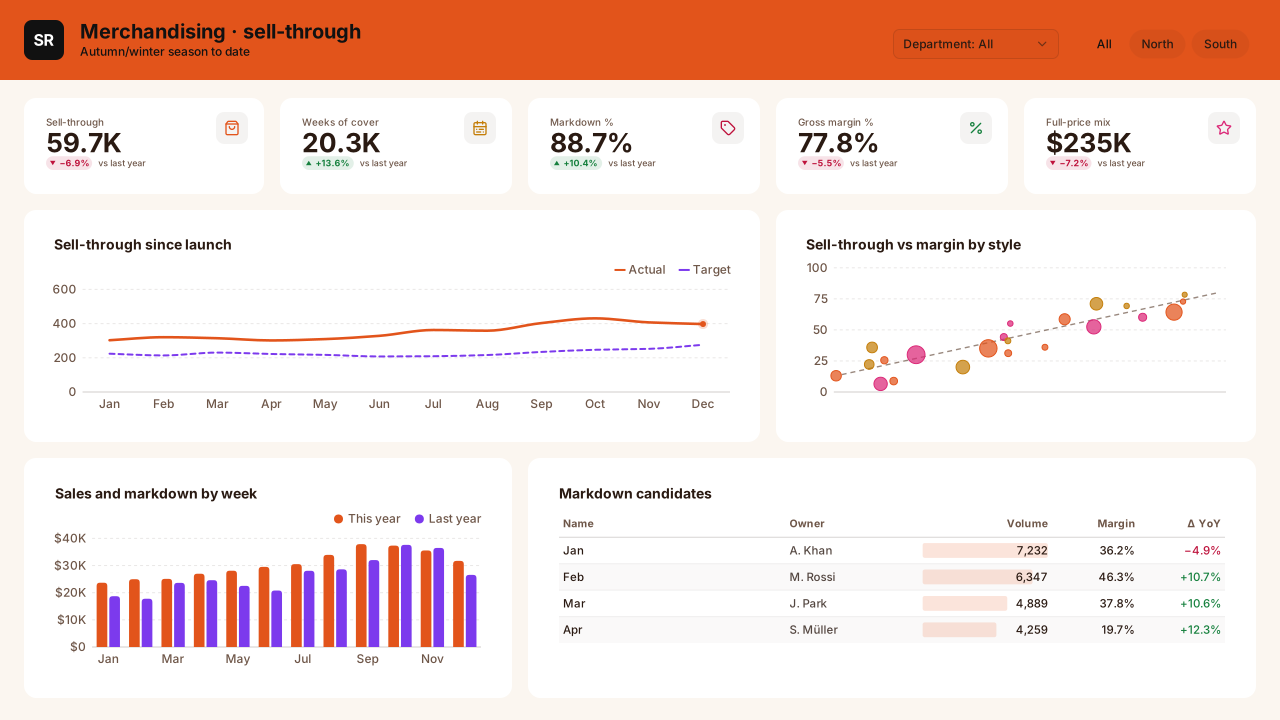 Retail & e-commerce
Retail Merchandising: Sell-Through
Band header with logo, 5 KPIs, cumulative sell-through lines + style scatter, weekly sales columns + markdown tableSunset RetailFree for commercial use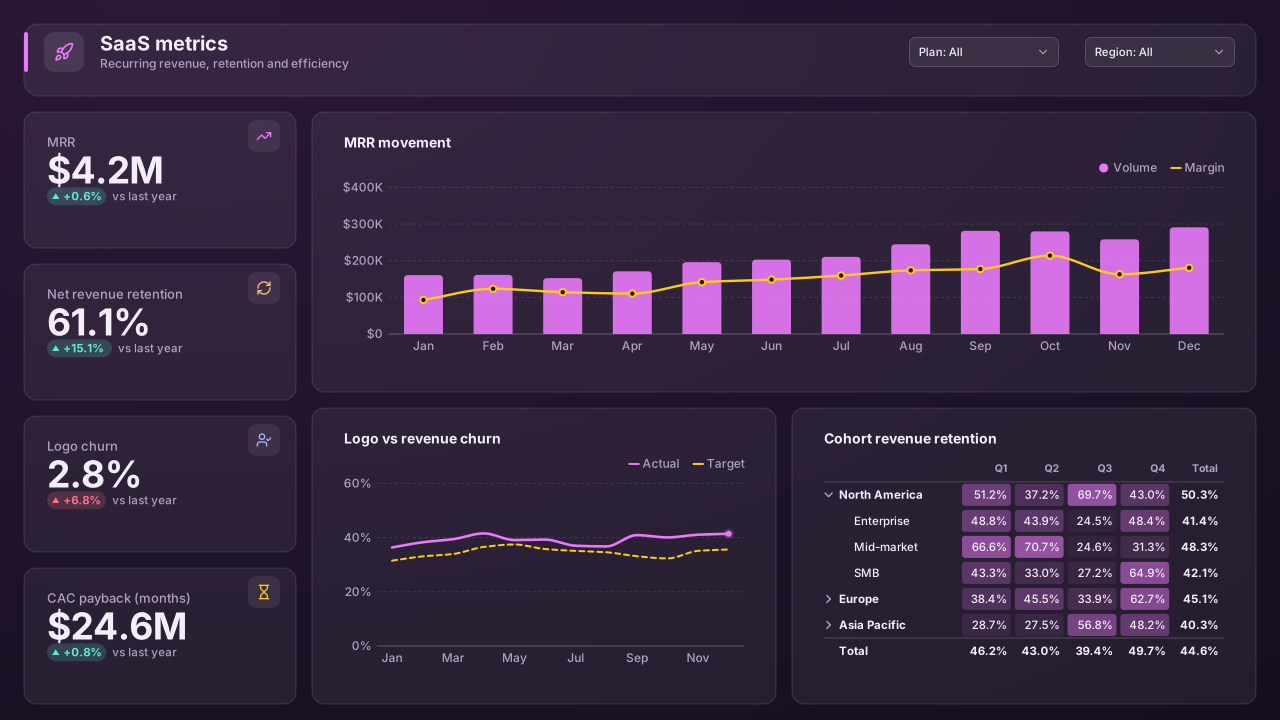 SaaS
SaaS Metrics: MRR & Churn
Glass header card, stacked KPI column, MRR movement, churn trend + cohort matrixPlum DuskFree for commercial use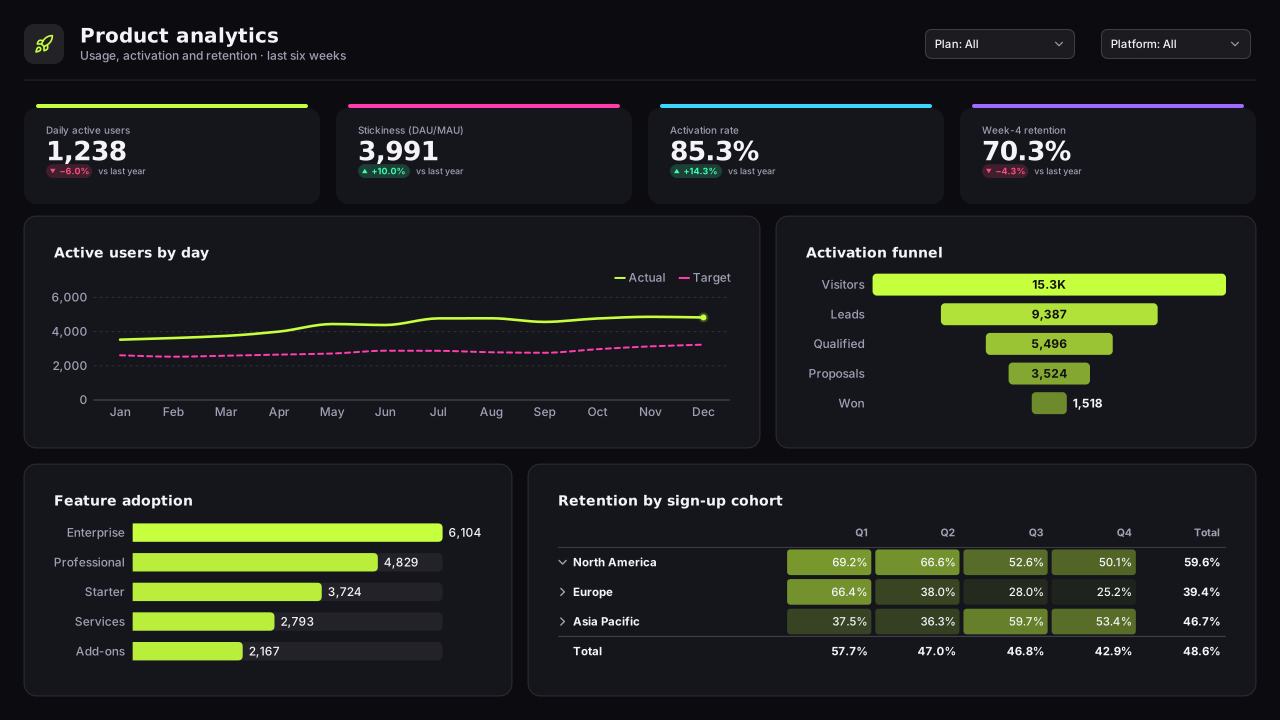 SaaS
Product Analytics & Feature Adoption
Plain header, 4 bold KPIs, daily active users + activation funnel, feature-adoption bars + retention cohort matrixCarbon NeonFree for commercial use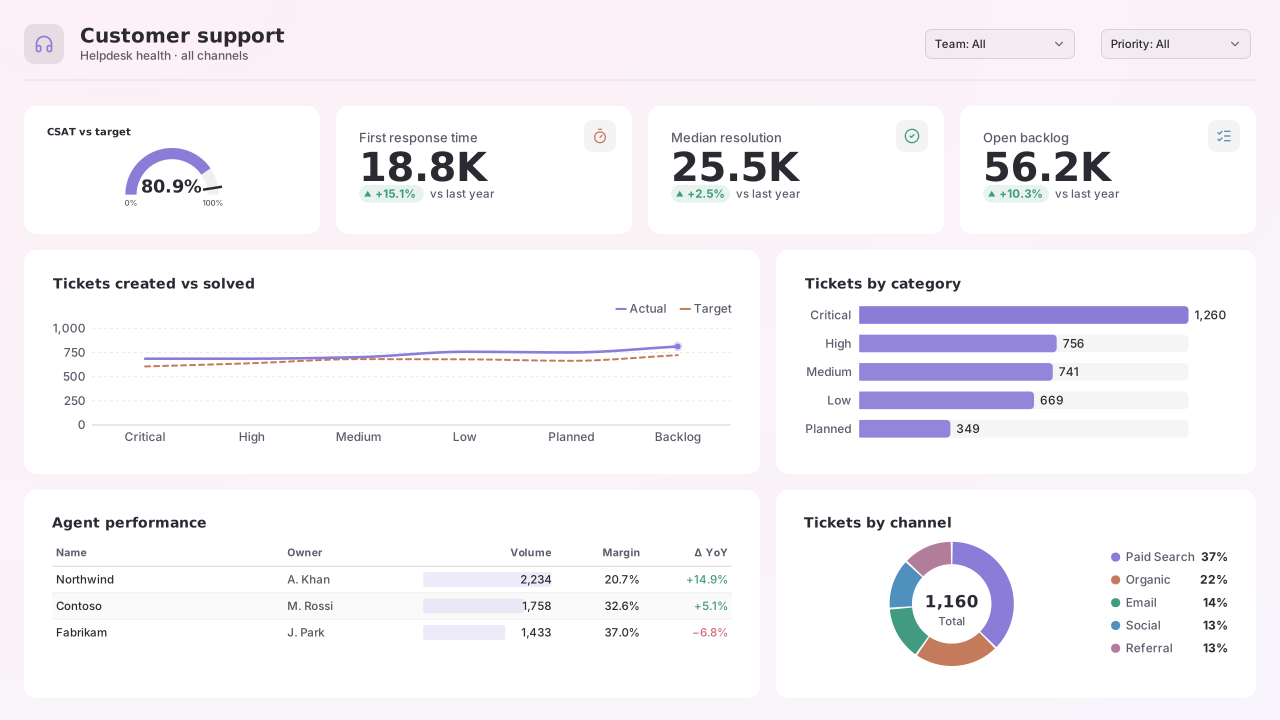 Operations
Customer Support
Plain header, gauge + 3 KPIs, trend and category bars, agent table and channel donutPastel StudioFree for commercial use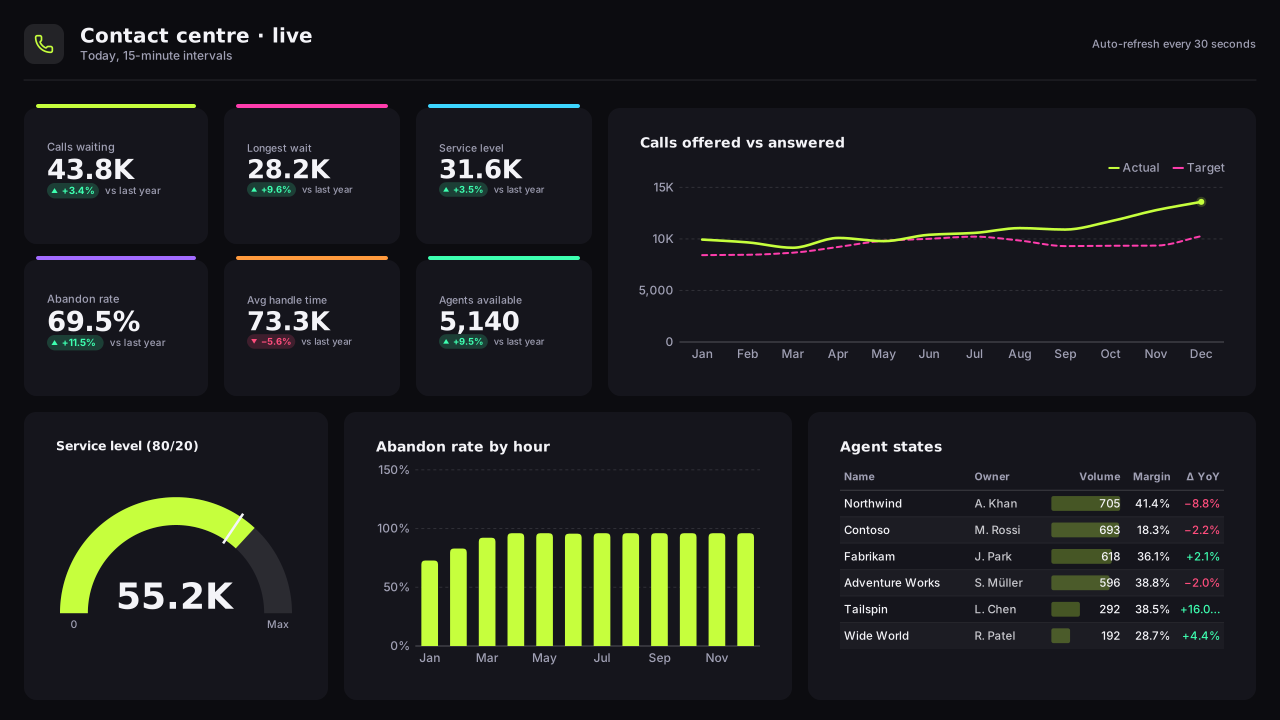 Operations
Call Centre Operations
Wallboard: 3×2 KPI tiles beside an interval trend, gauge + bars + agent tableCarbon NeonFree for commercial use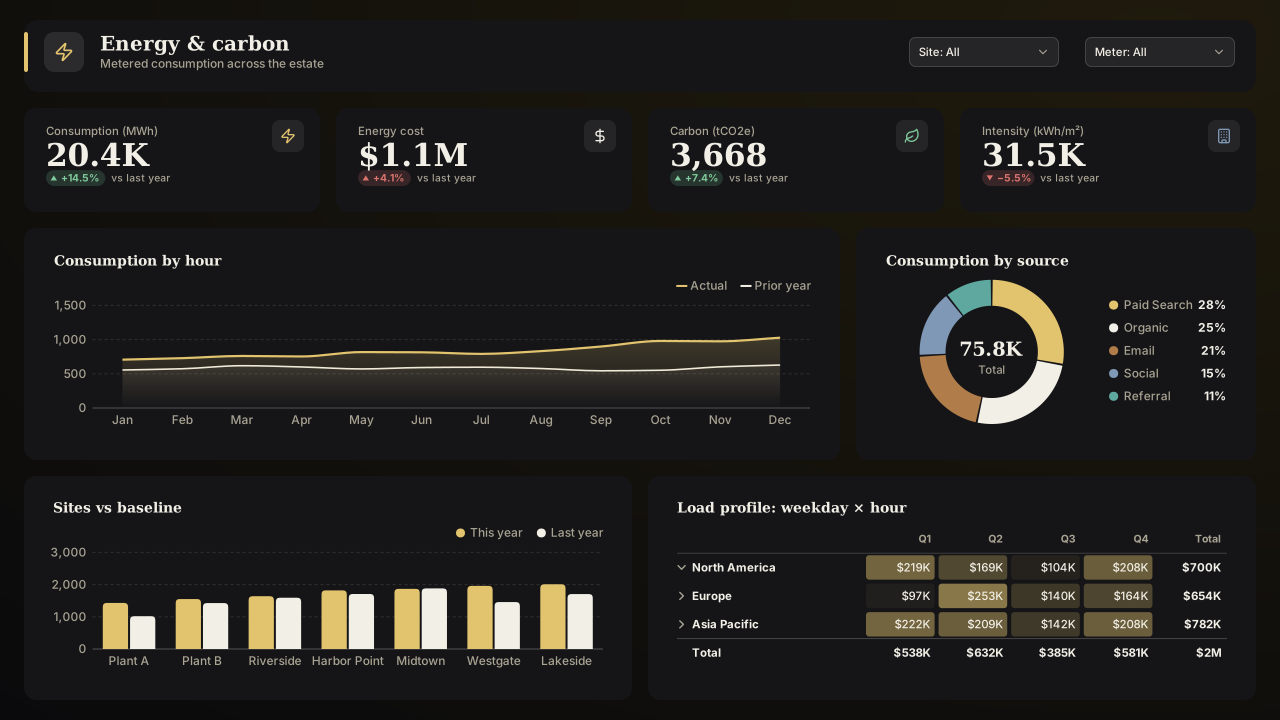 Operations
Energy Consumption
Header card, 4 KPIs, hourly area + source donut, site columns + load-profile matrixObsidian GoldFree for commercial use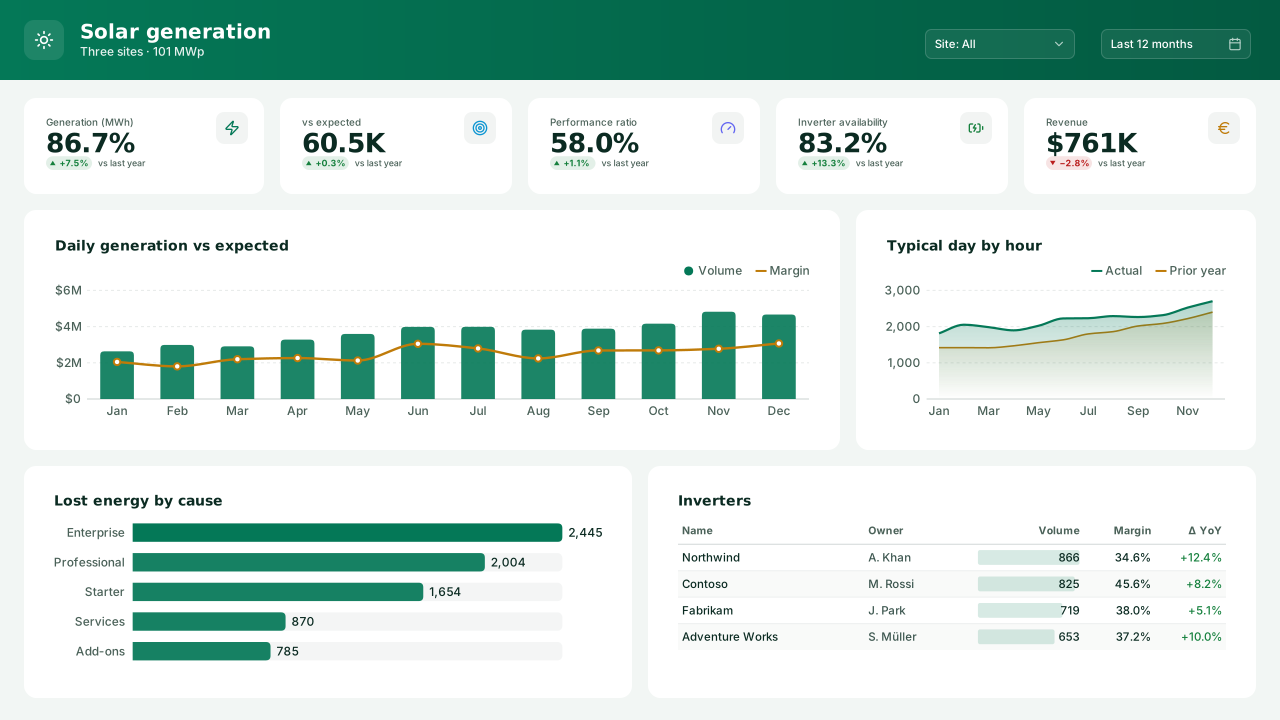 Operations
Solar Generation
Gradient band header, 5 KPIs, daily generation combo + typical-day area, loss bars + inverter tableEmerald FinanceFree for commercial use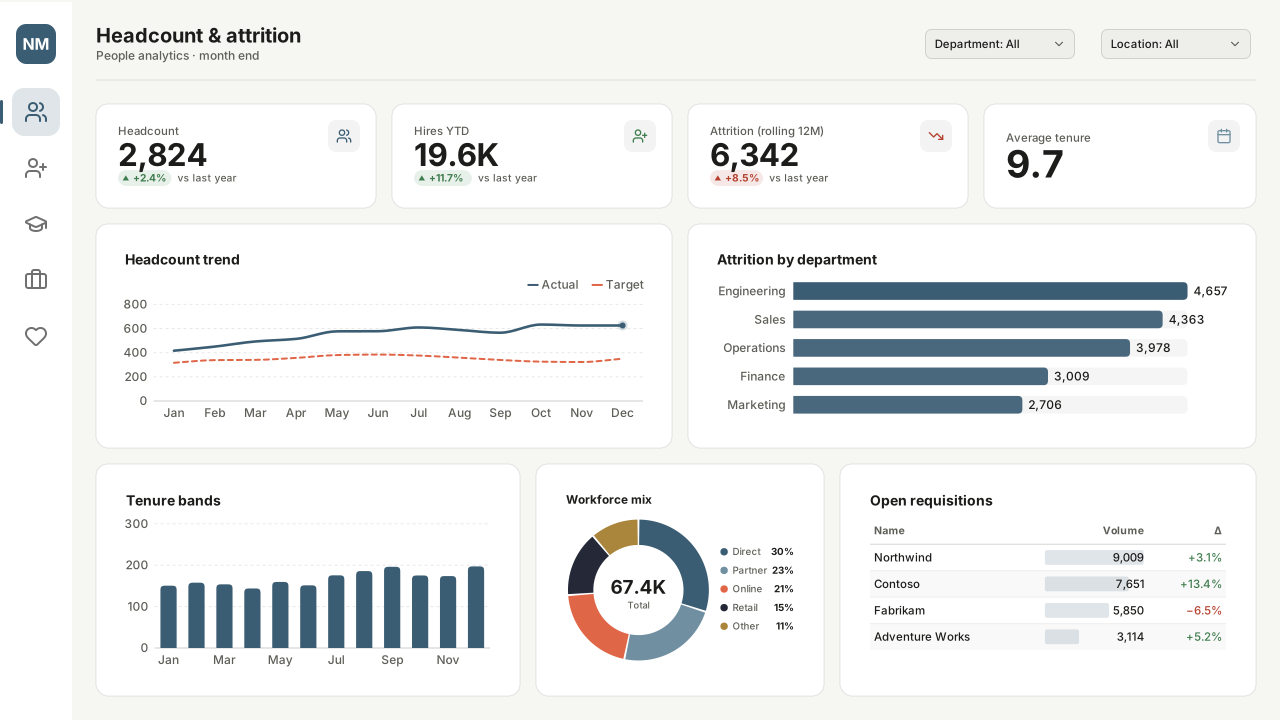 HR & people
HR Headcount & Attrition
Left nav rail, 4 KPIs, two trend panels, three-panel workforce rowNordic MinimalFree for commercial use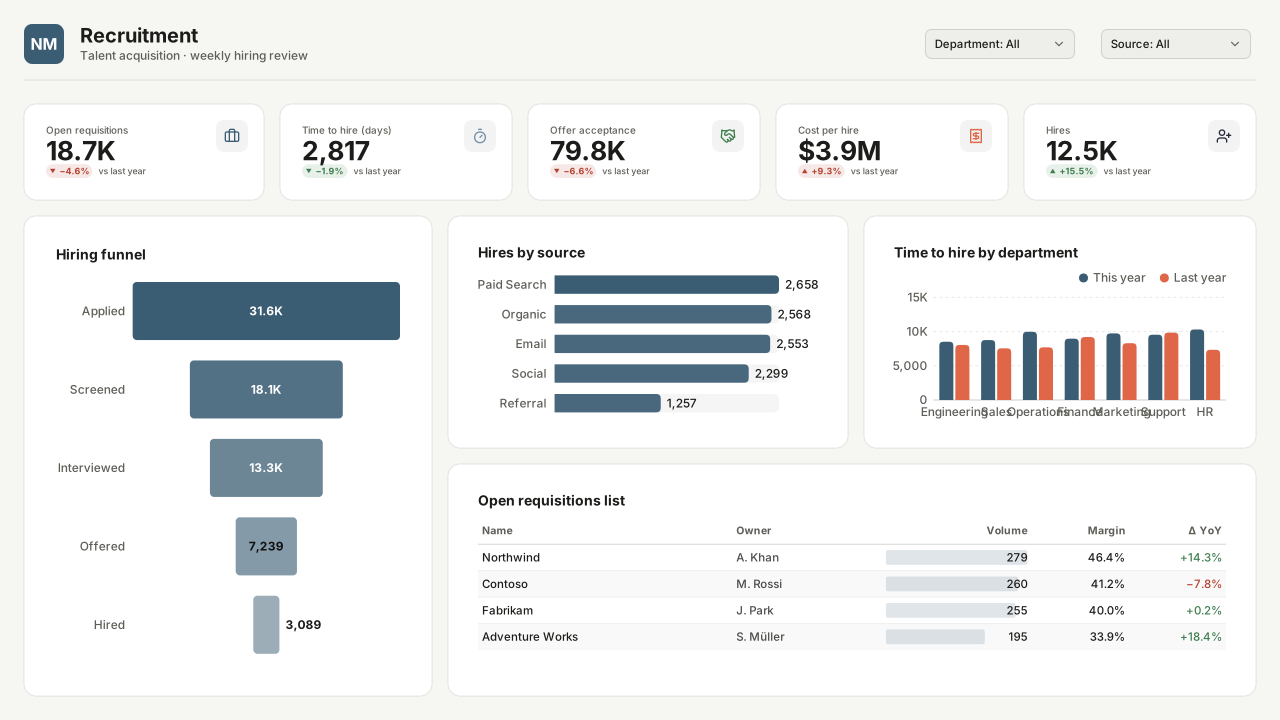 HR & people
Recruitment & Hiring Funnel
Plain header with logo, 5 KPIs, tall funnel left, source bars + department columns + open-requisition table rightNordic MinimalFree for commercial use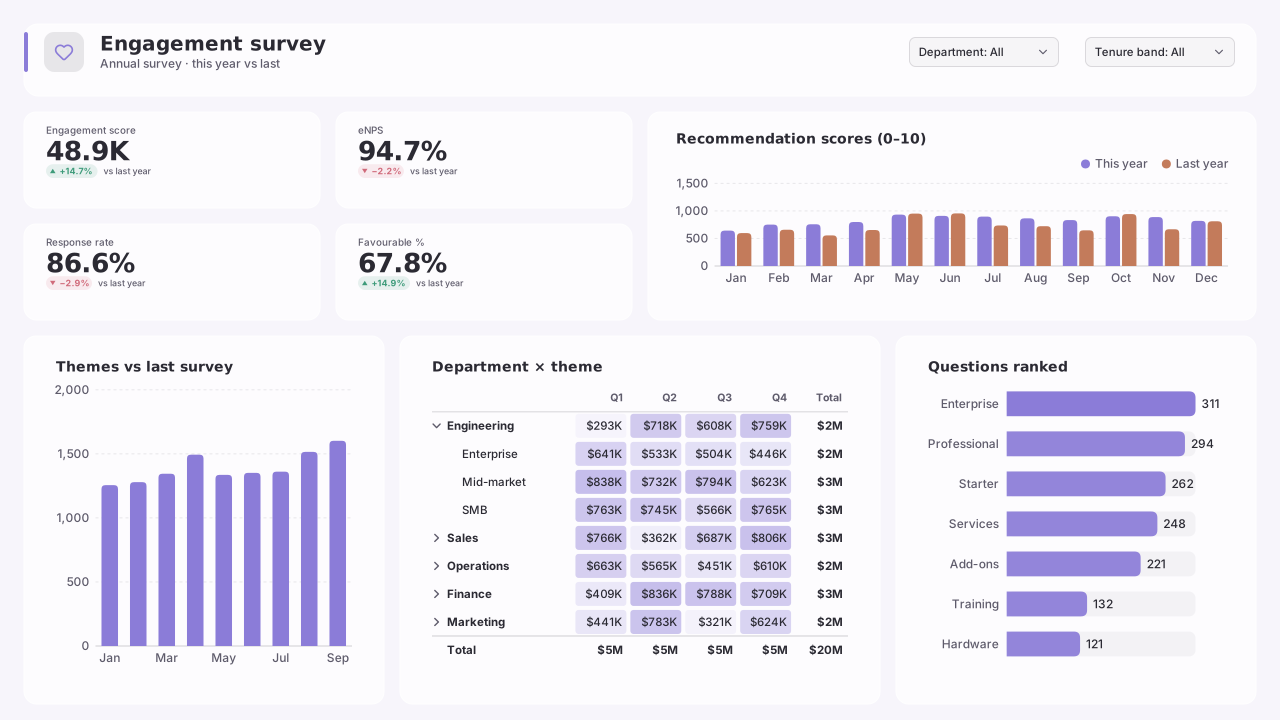 HR & people
Employee Engagement Survey
Glass header card, 4 KPIs beside eNPS score columns, theme comparison + department heatmap + question rankingPastel StudioFree for commercial use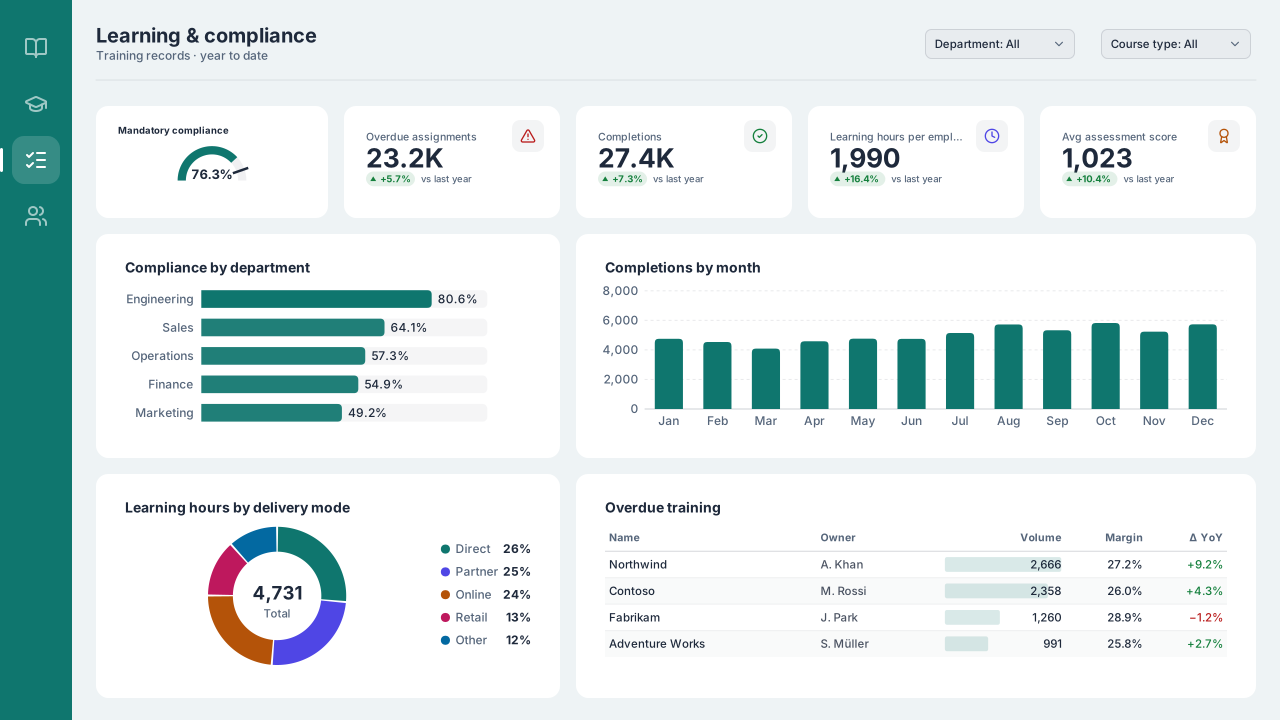 HR & people
Learning & Training Compliance
Left nav rail, compliance gauge + 4 KPIs, department bars + monthly completions, delivery donut + overdue tableArctic TealFree for commercial use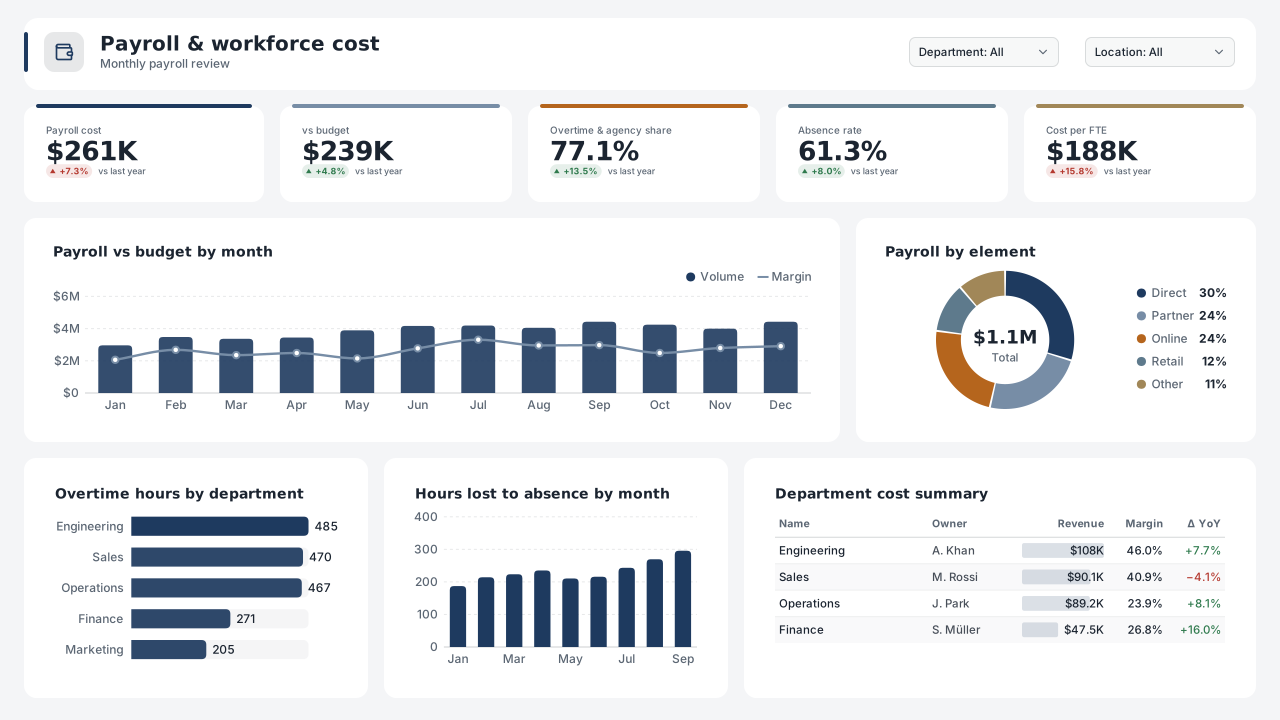 HR & people
Payroll, Overtime & Absence
Header card, 5 bold KPIs, payroll combo + pay-element donut, overtime bars + absence columns + department tableSlate ExecutiveFree for commercial use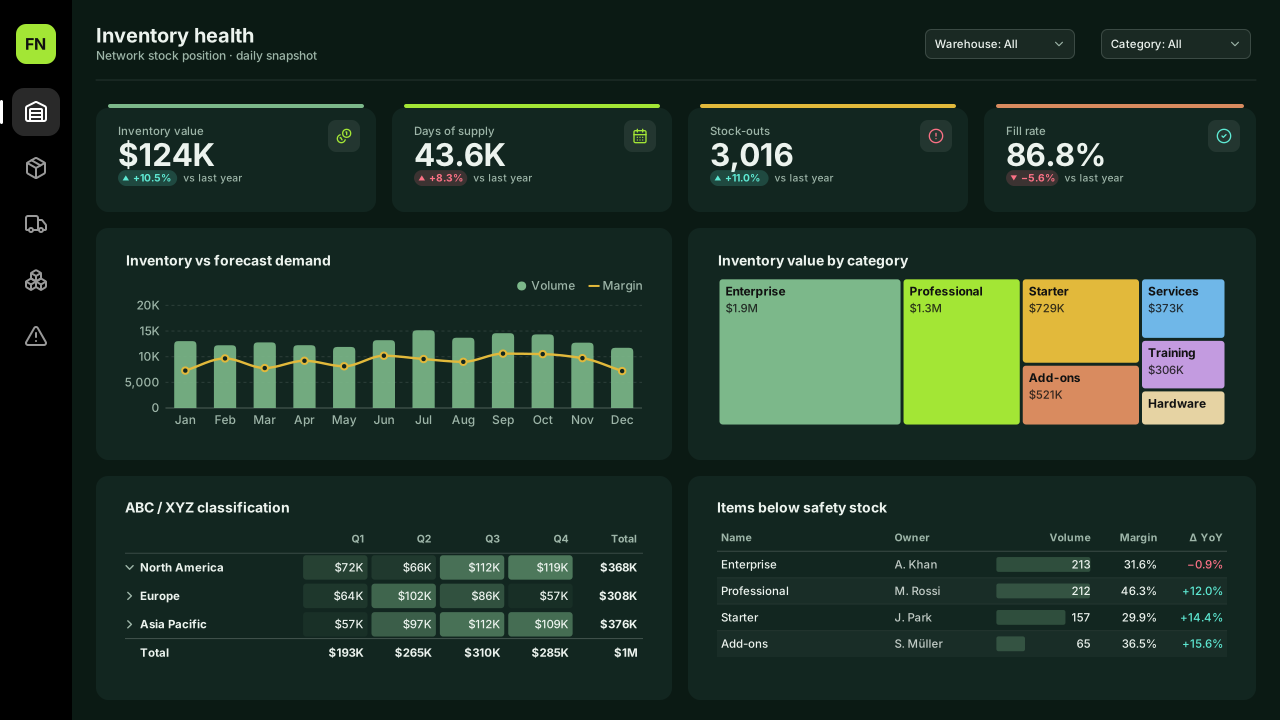 Supply chain
Supply Chain Inventory
Left nav rail, 4 KPIs, 2×2 grid of analysis panelsForest NightFree for commercial use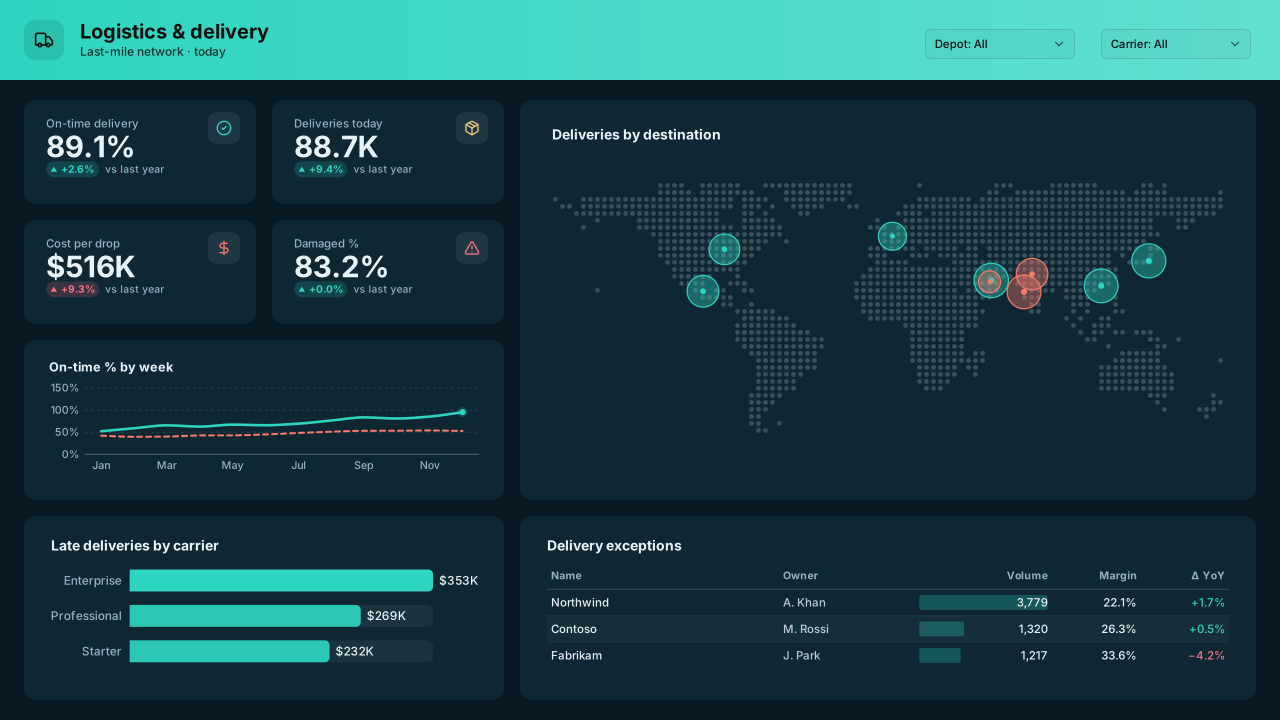 Supply chain
Logistics & Delivery
Gradient band header, KPI grid + trend left, large map right, bars + exceptions tableOcean DeepFree for commercial use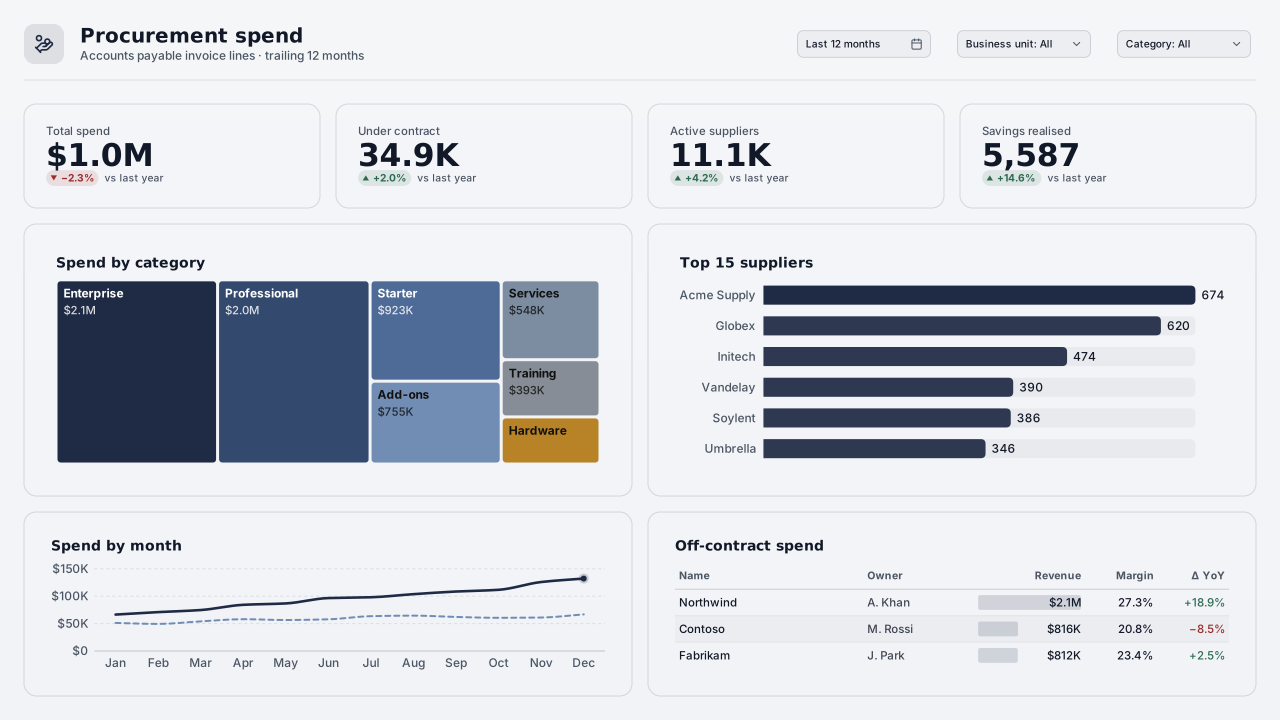 Supply chain
Procurement Spend Analysis
Plain header with 3 slicers, 4 outline KPIs, treemap + supplier bars, trend + off-contract tableMonochrome InkFree for commercial use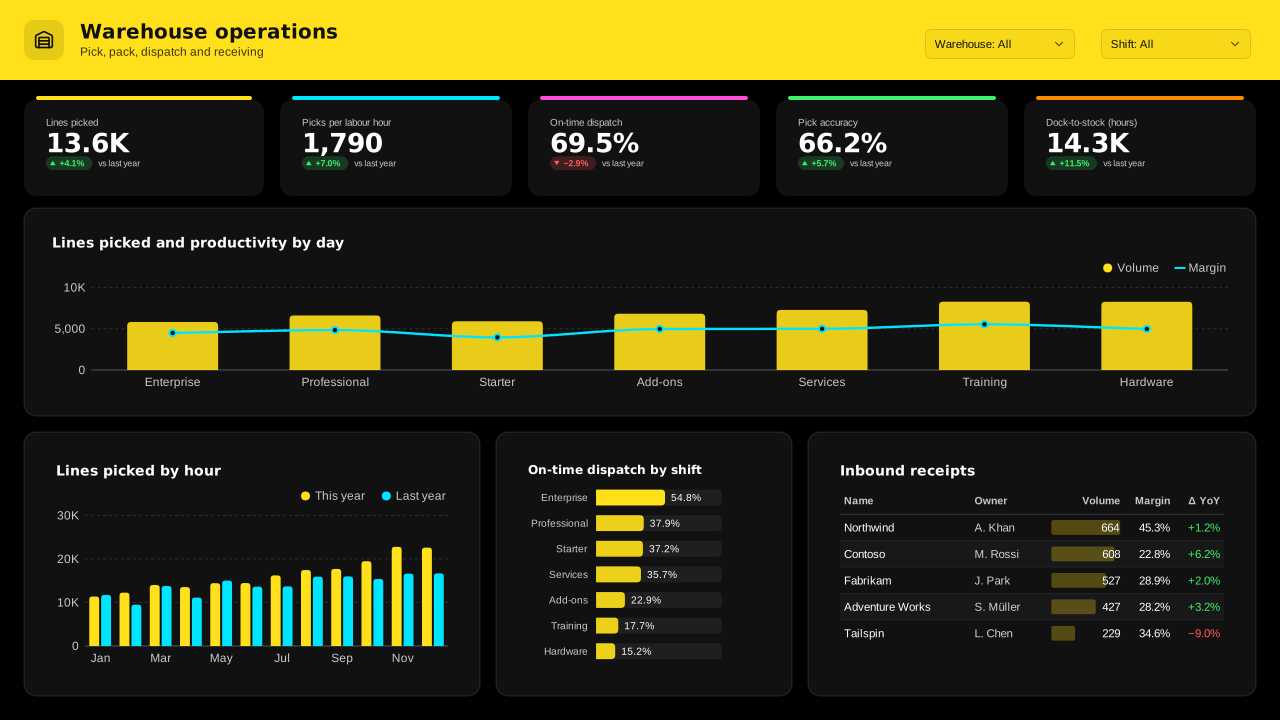 Supply chain
Warehouse Operations
Band header, 5 bold KPIs, daily volume + productivity combo, hourly columns + shift bars + receipts tableHigh Contrast DarkFree for commercial use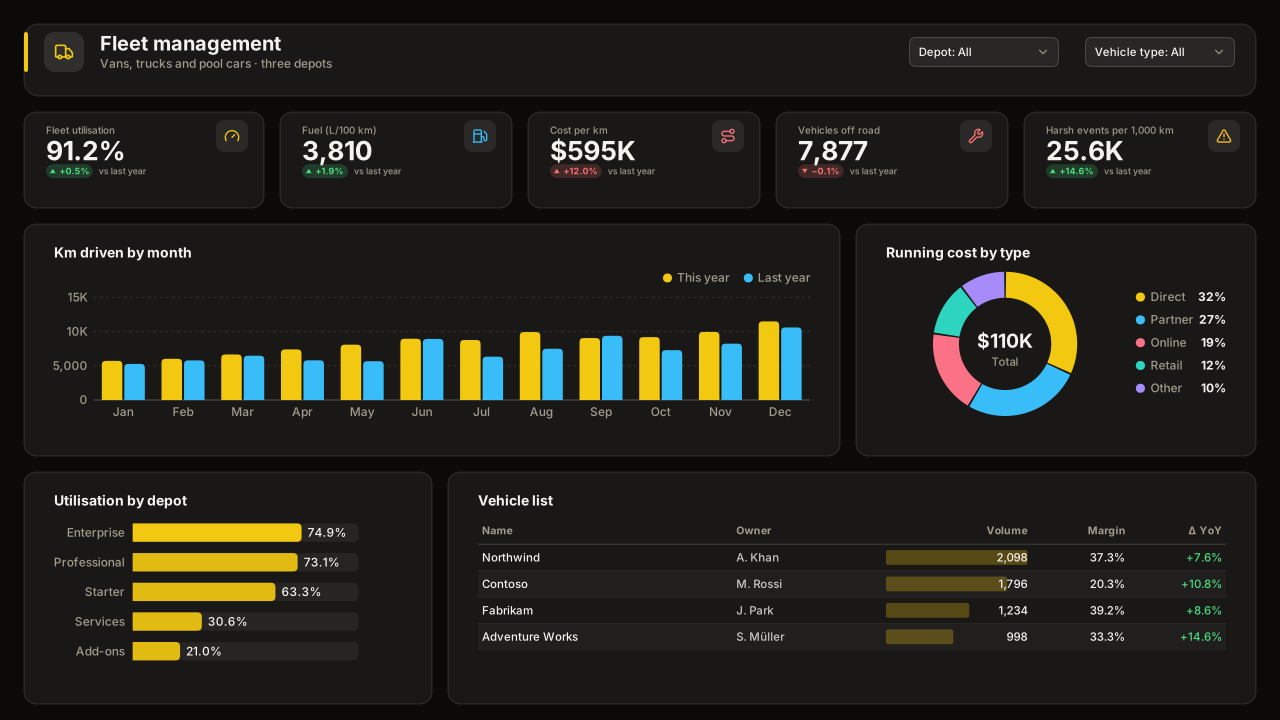 Supply chain
Fleet Management
Glass header card, 5 KPIs, km by month + cost donut, depot bars + vehicle listVizForge InkFree for commercial use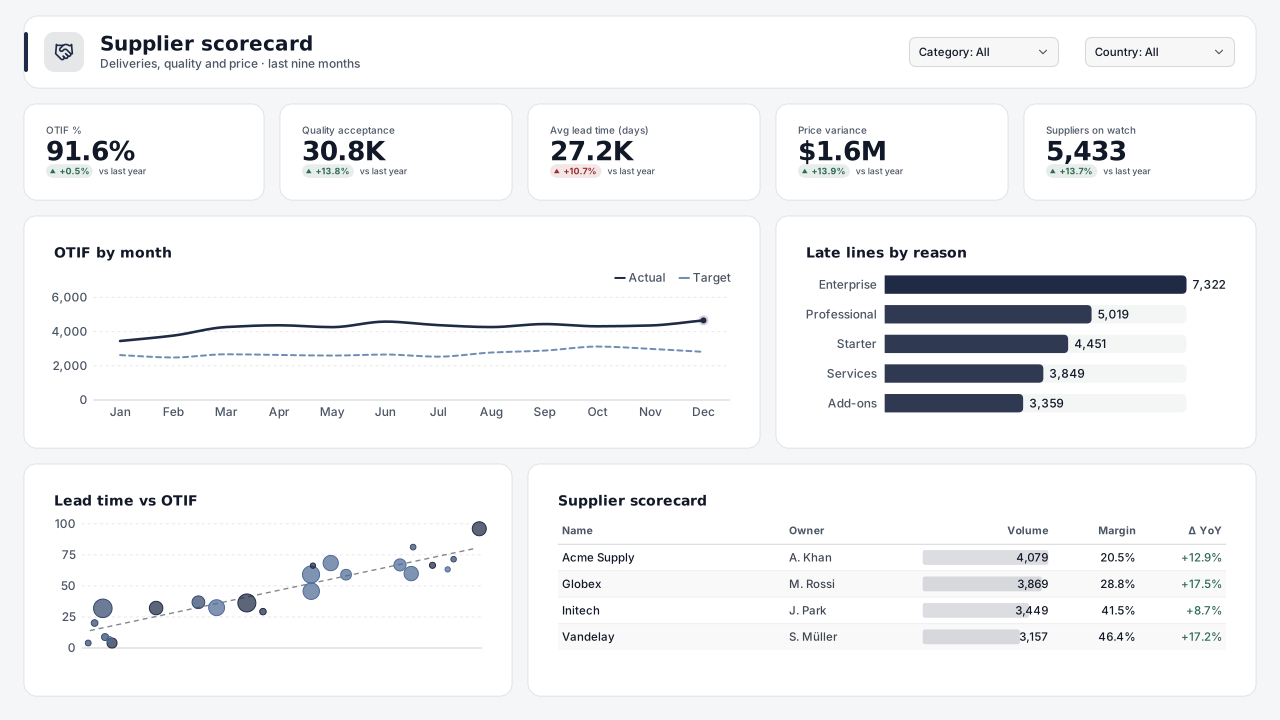 Supply chain
Supplier Performance Scorecard
Header card, 5 flat KPIs, OTIF trend + late-reason bars, lead-time scatter + supplier scorecard tableMonochrome InkFree for commercial use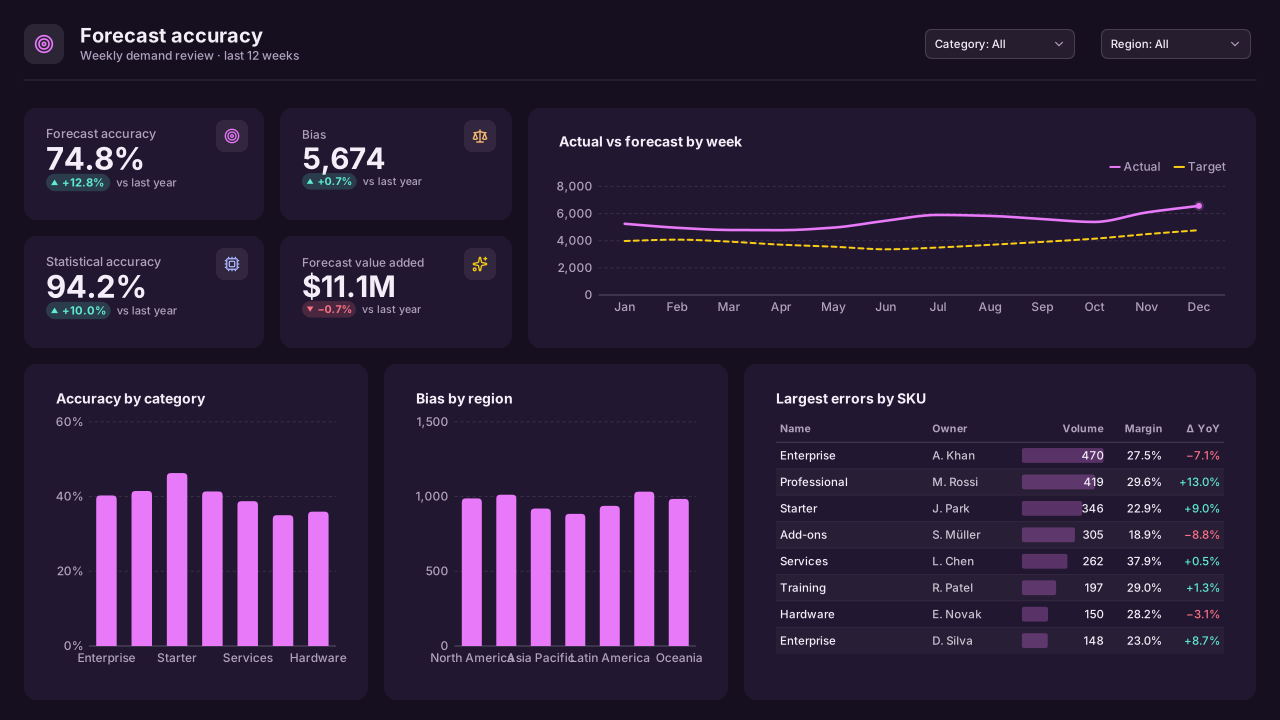 Supply chain
Demand Forecast Accuracy
Plain header, 2×2 KPI block beside actual-vs-forecast lines, category + region columns and error tablePlum DuskFree for commercial use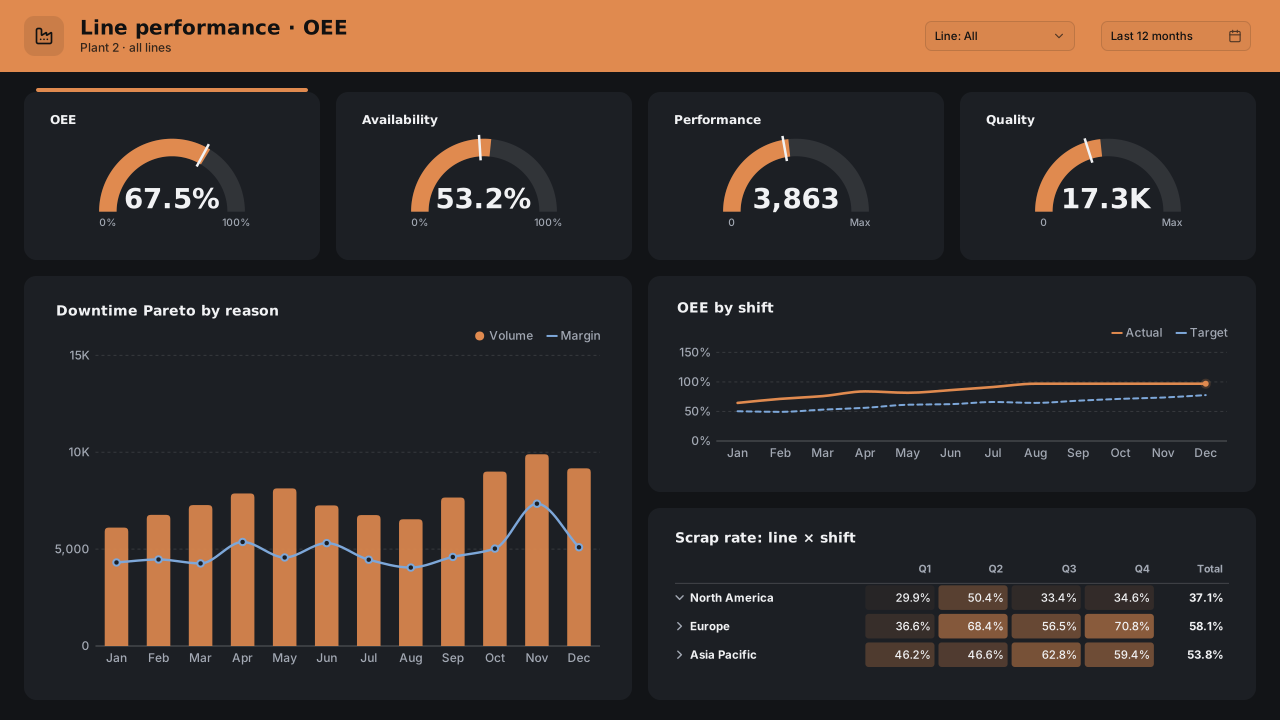 Manufacturing
 OEE
Copper band header, 4 gauges, full-height Pareto beside shift trend and scrap matrixCopper IndustrialFree for commercial use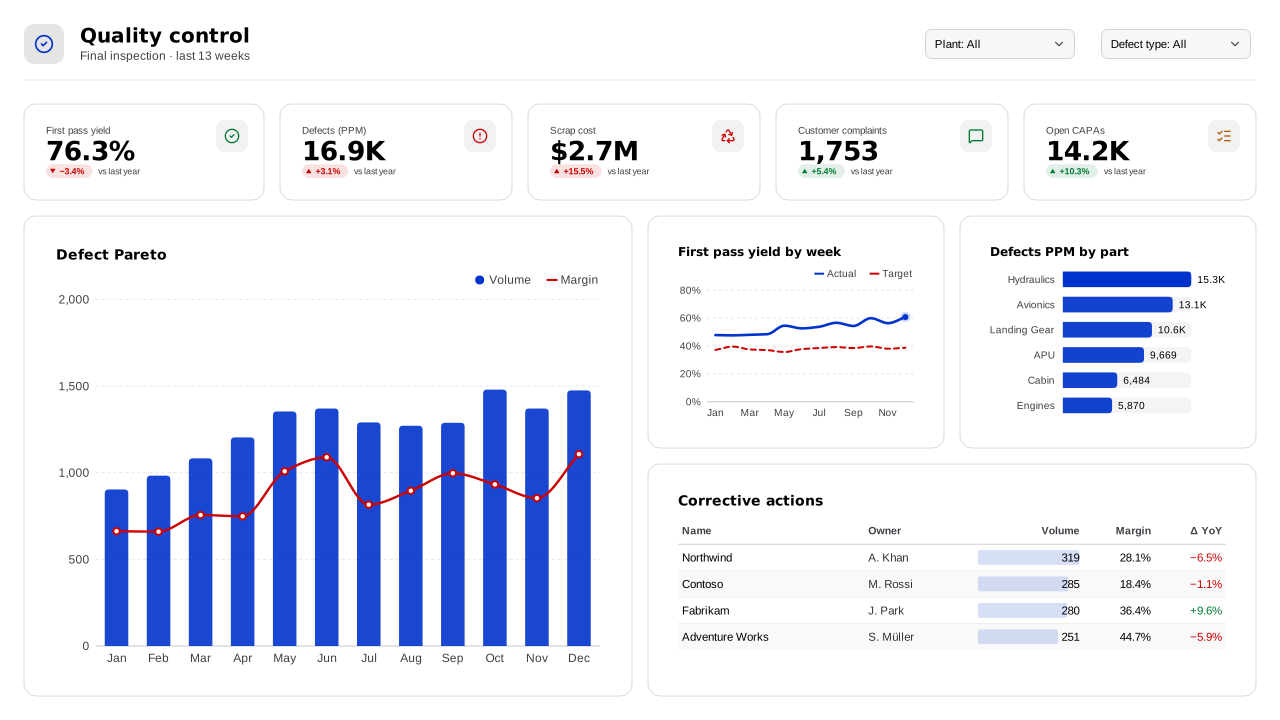 Manufacturing
 Quality Control
Plain header, 5 outline KPIs, full-height defect Pareto beside yield trend, PPM bars + CAPA tableHigh Contrast LightFree for commercial use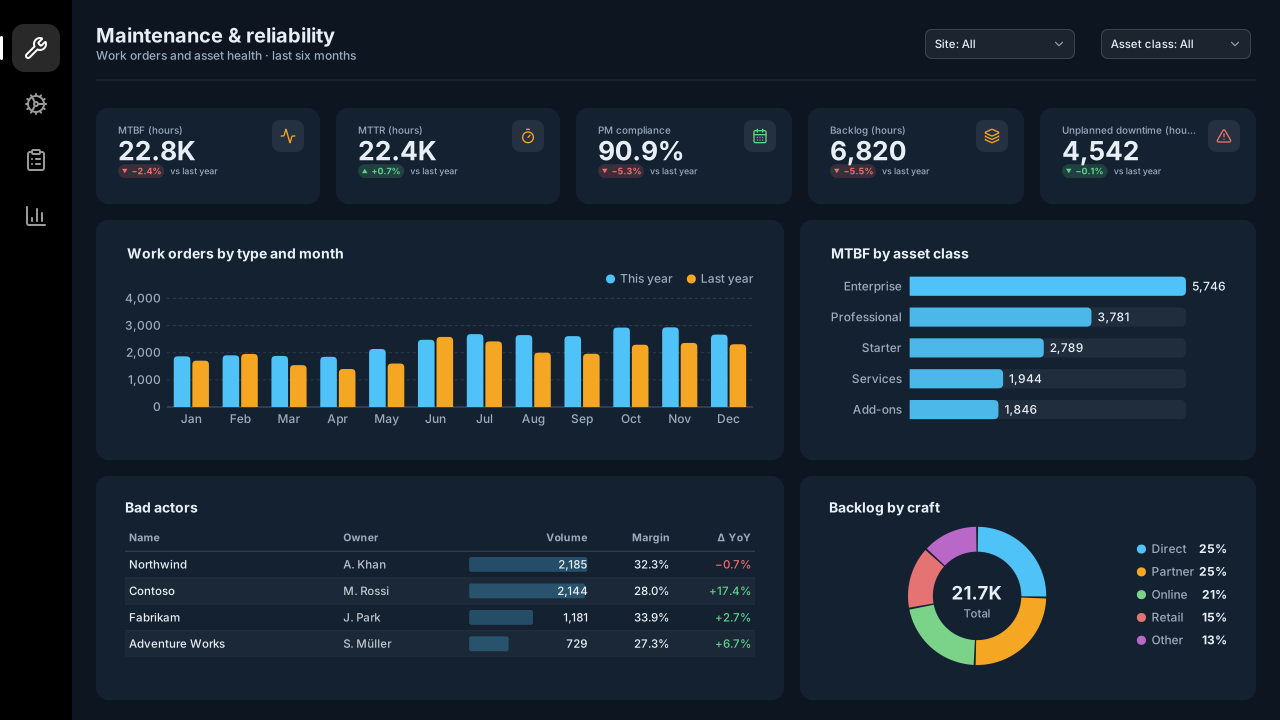 Manufacturing
Maintenance & Asset Reliability
Left nav rail, 5 KPIs, stacked work-order columns + MTBF bars, bad-actor table + backlog donutAviation OpsFree for commercial use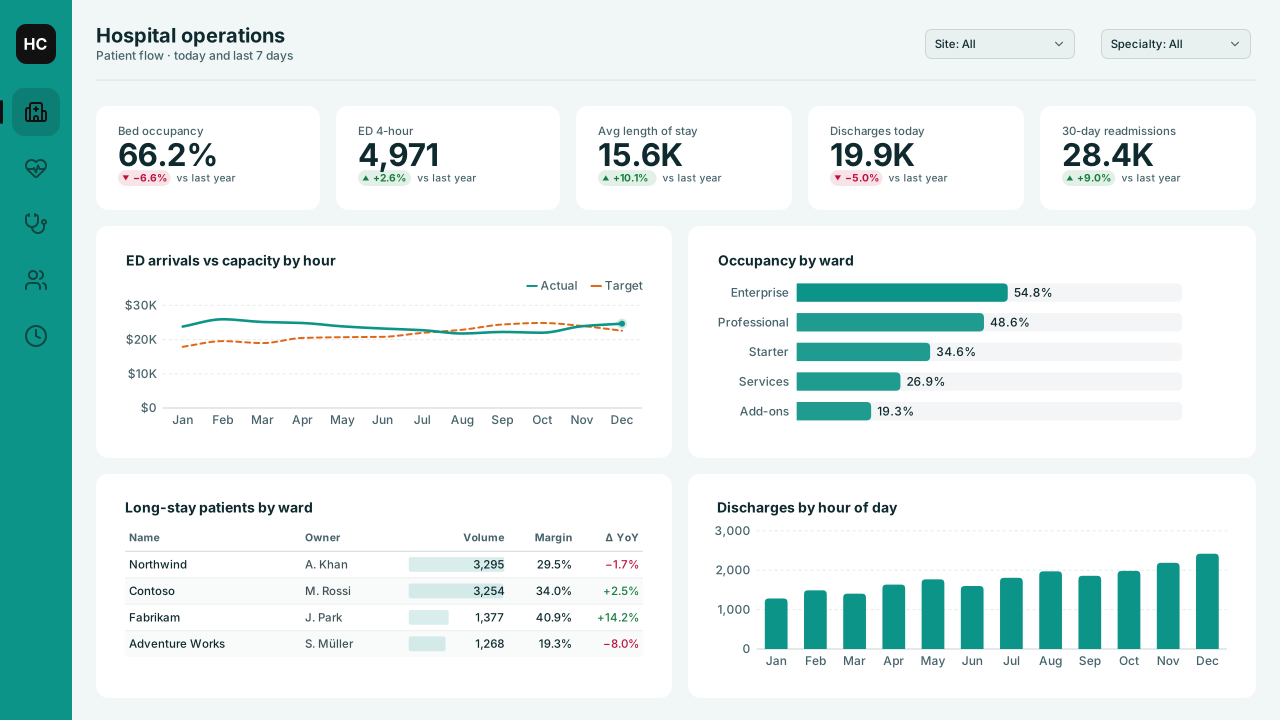 Healthcare
 Operations
Left nav rail, 5 KPIs, arrivals trend + ward bars, long-stay table + discharge timingHealthcare CalmFree for commercial use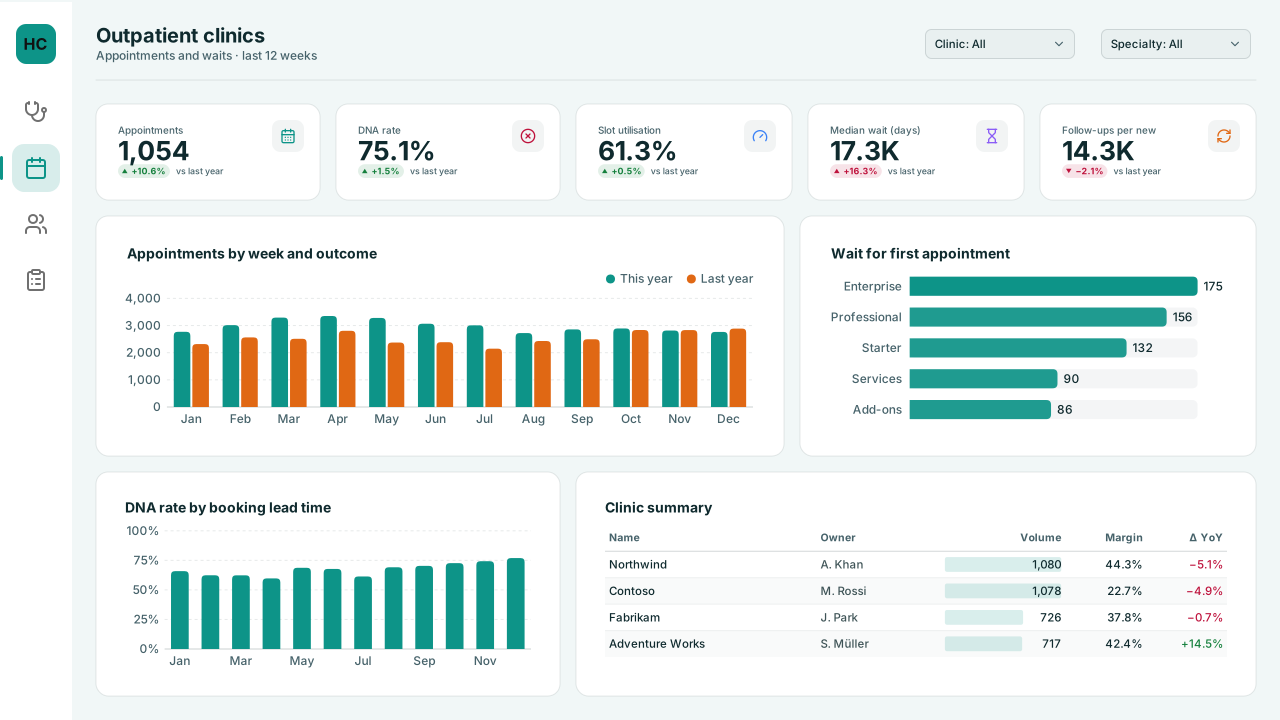 Healthcare
Outpatient Clinic Appointments
Left nav rail, 5 KPIs, weekly outcome columns + wait bars, lead-time DNA columns + clinic tableHealthcare CalmFree for commercial use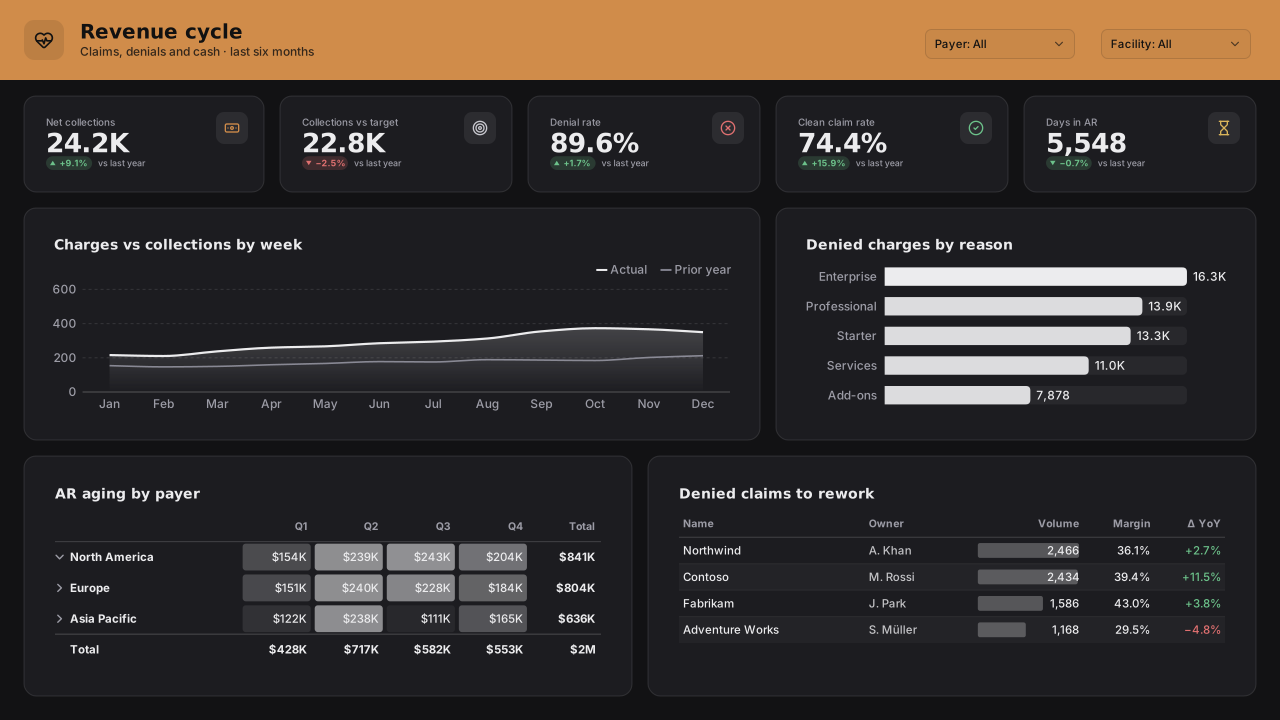 Healthcare
 Revenue Cycle
Band header, 5 KPIs, weekly charges vs collections + denial-reason bars, payer × aging matrix + rework tableGraphite MonoFree for commercial use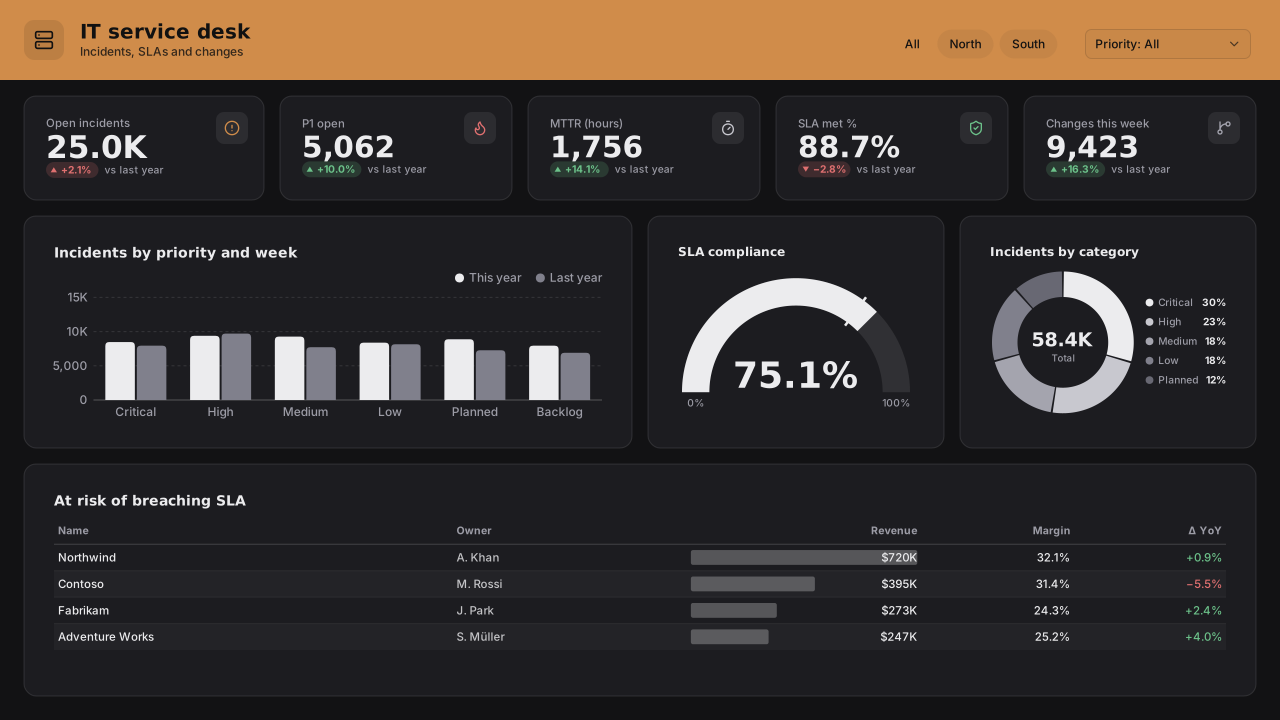 IT
IT Service Desk
Header band, 5 KPIs, trend + gauge + donut, full-width breach-risk tableGraphite MonoFree for commercial use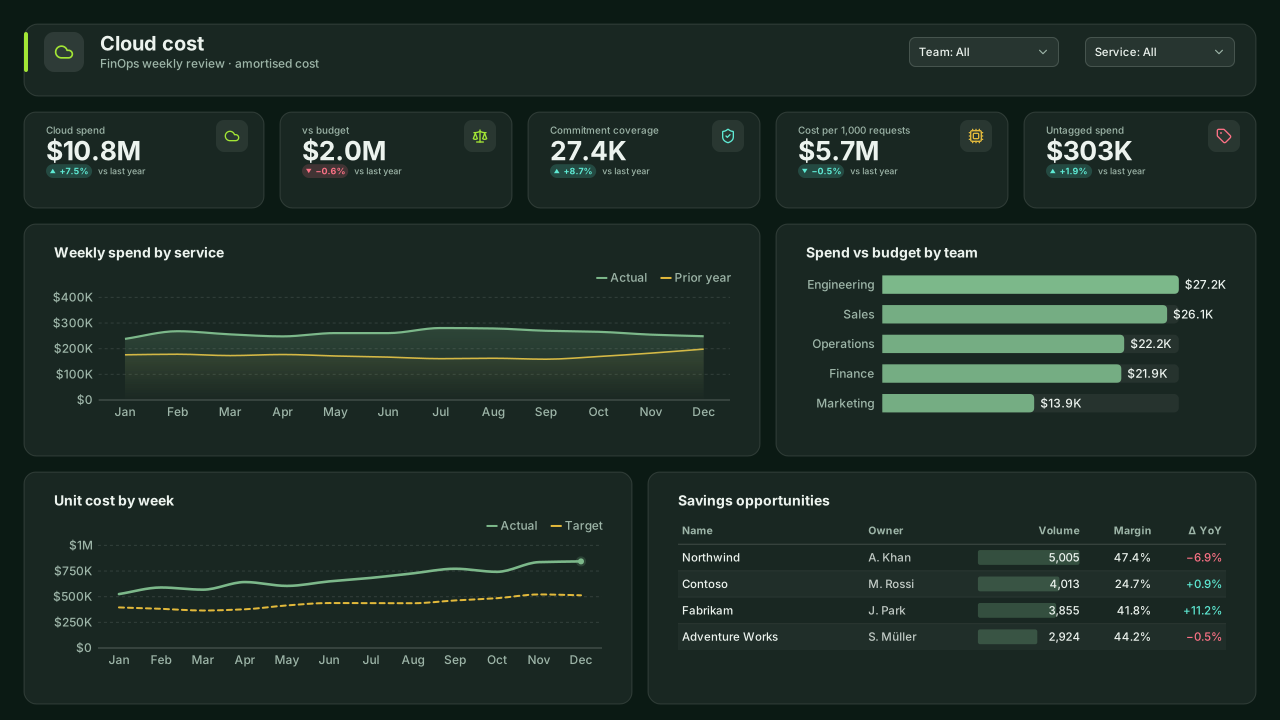 IT
Cloud Cost (FinOps)
Glass header card, 5 KPIs, stacked service area + team bars, unit-cost lines + savings tableForest NightFree for commercial use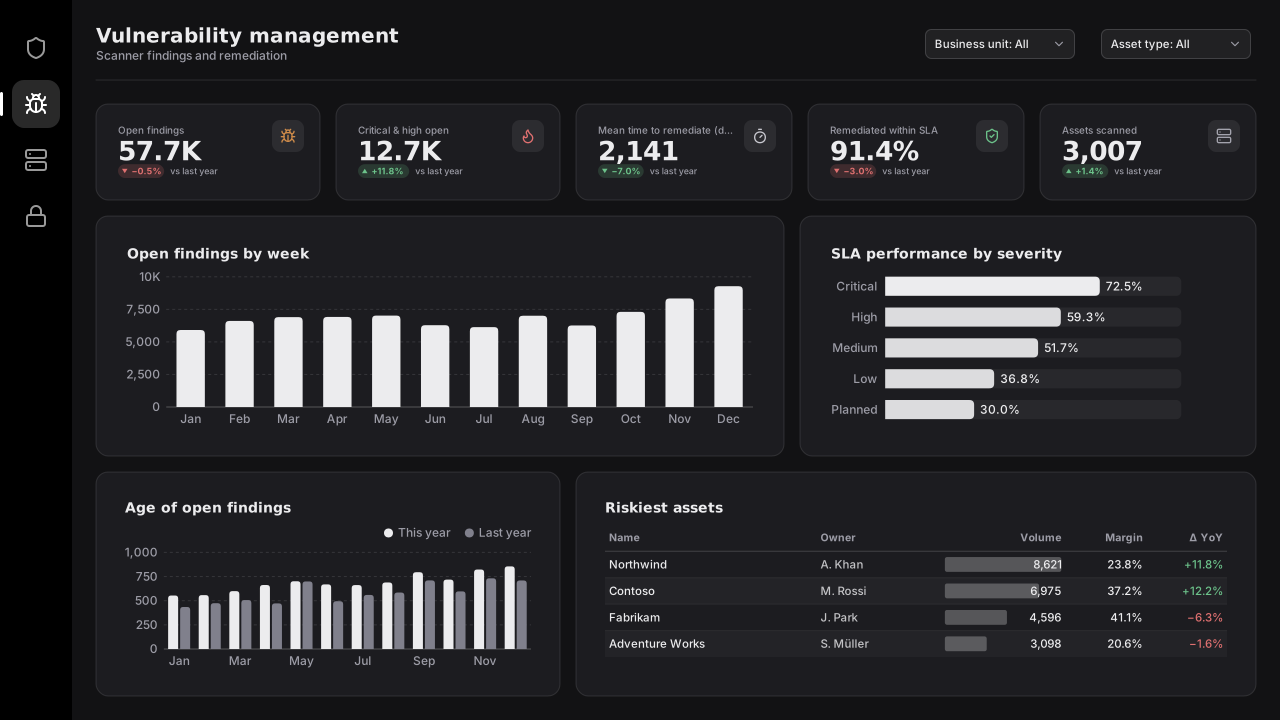 IT
Vulnerability Management
Left nav rail, 5 KPIs, open-findings trend + SLA bars, age columns + riskiest-asset tableGraphite MonoFree for commercial use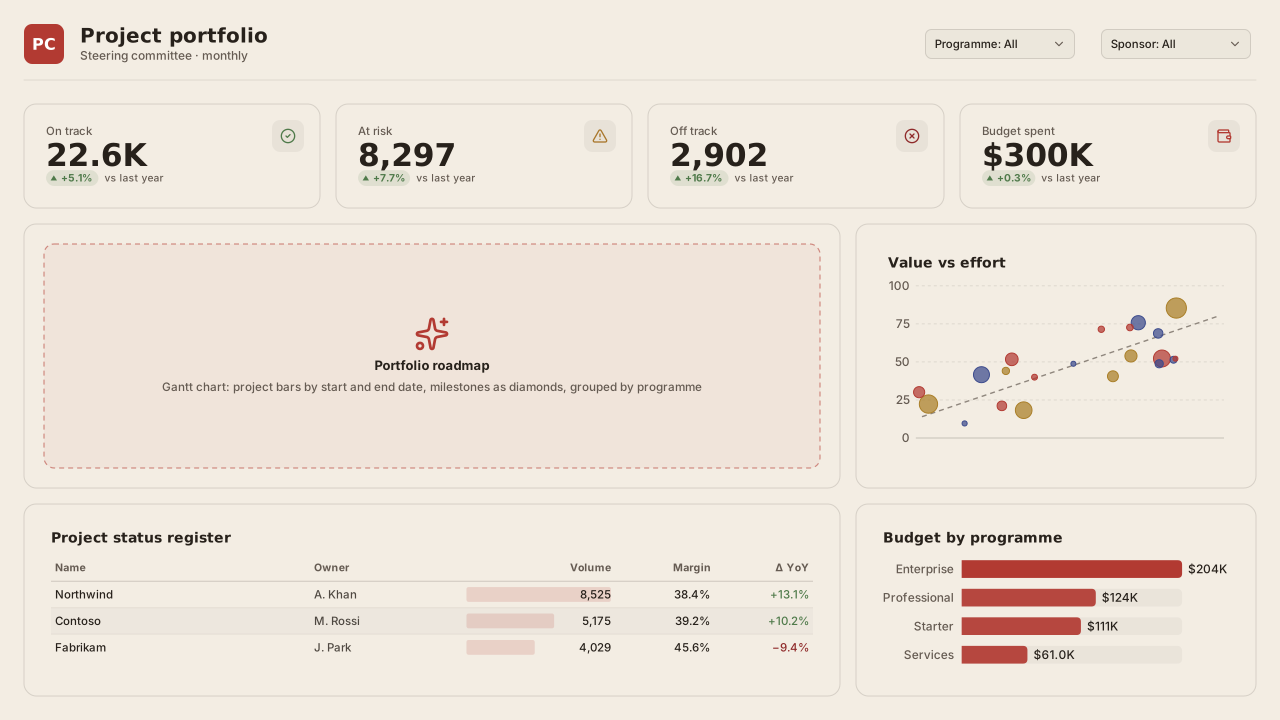 Project & PMO
Project Portfolio
Logo header, 4 RAG KPIs, roadmap + value/effort scatter, register + budget barsPaper & ClayFree for commercial use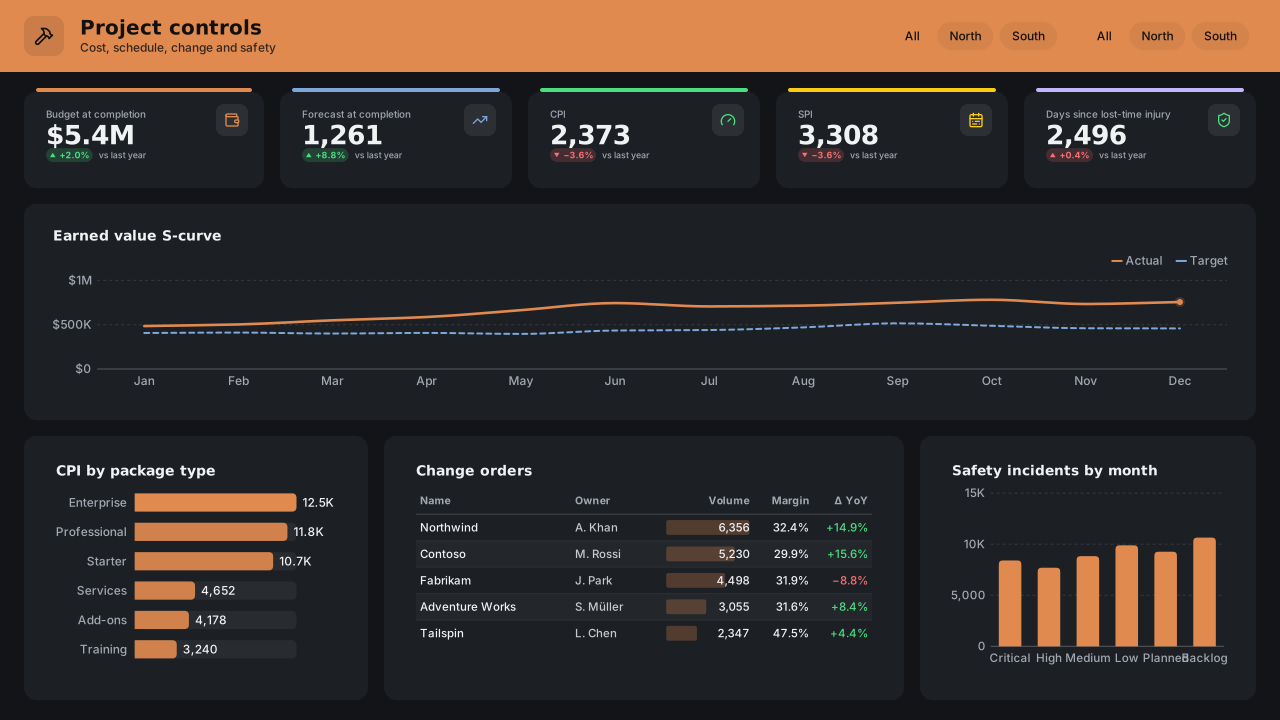 Project & PMO
Construction Project Controls
Band header, 5 KPIs, full-width earned-value S-curve, CPI bars + change-order table + safety columnsCopper IndustrialFree for commercial use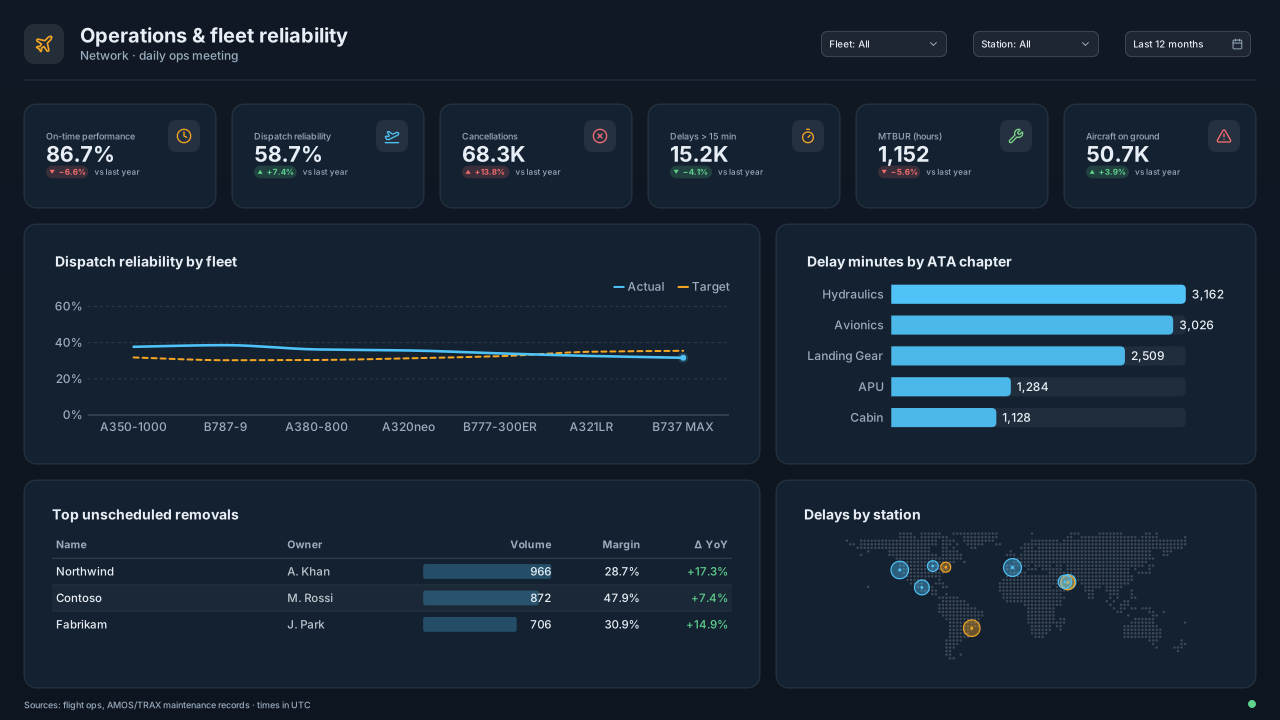 Aviation
Airline Operations & Fleet Reliability
Plain header with 3 slicers, 6 KPIs, reliability trend + ATA bars, removals table + station mapAviation OpsFree for commercial use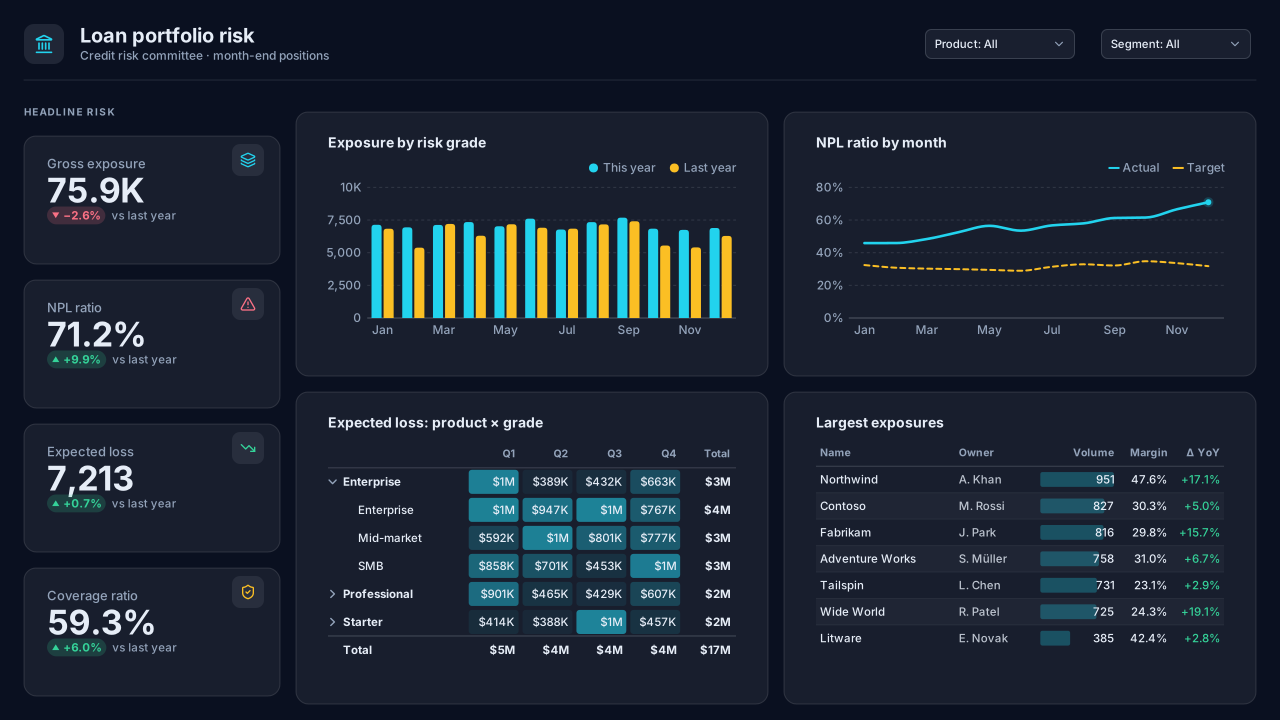 Banking
Loan Portfolio Risk
Left KPI column under a plain header, risk-grade columns + NPL trend, product × grade matrix + large-exposure tableMidnight AnalyticsFree for commercial use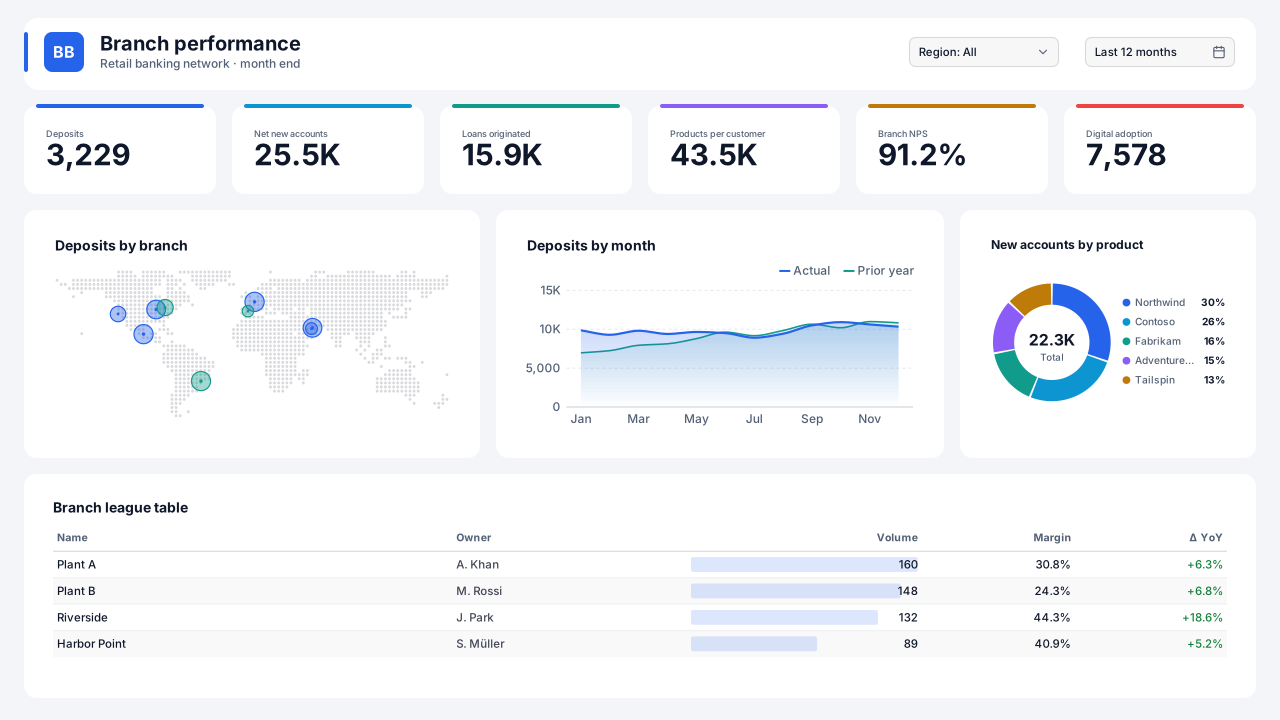 Banking
Retail Banking Branch Performance
Logo header card, 6 compact KPIs, branch map + deposit trend + product donut, full-width league tableBoardroom BlueFree for commercial use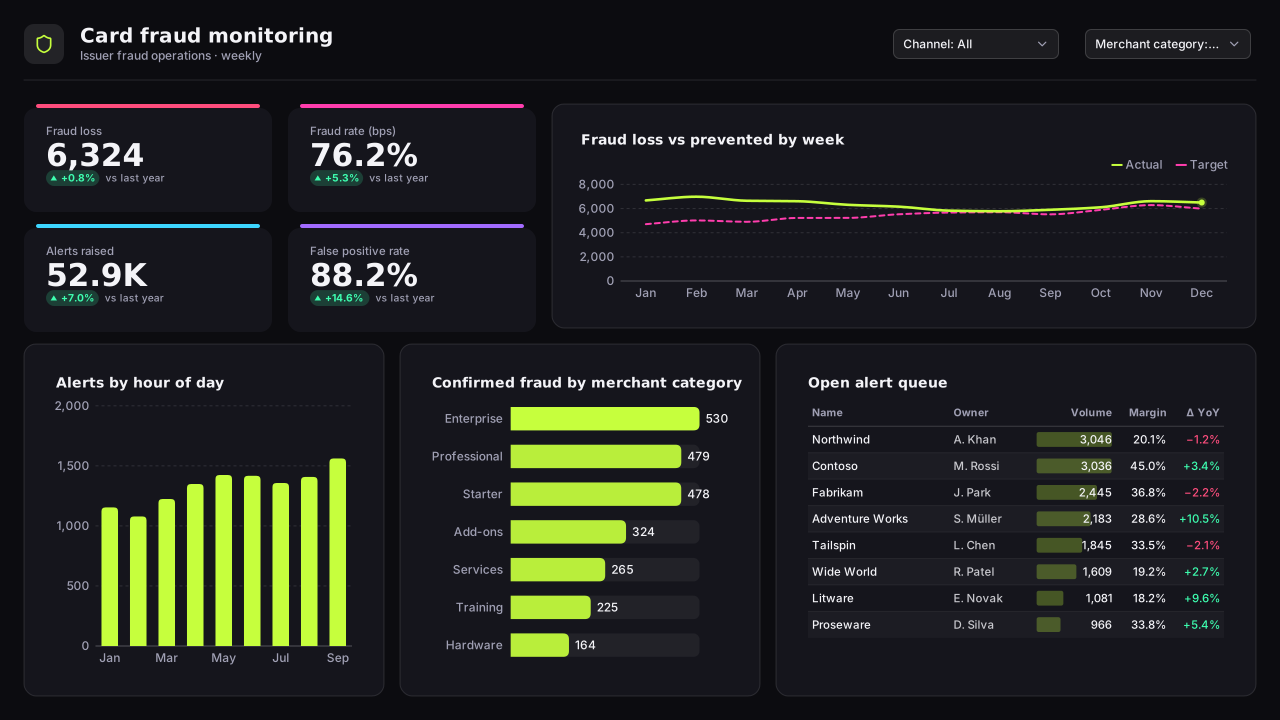 Banking
Card Fraud Monitoring
2×2 KPI block beside a weekly loss trend, hour-of-day columns + merchant bars + open-alert queueCarbon NeonFree for commercial use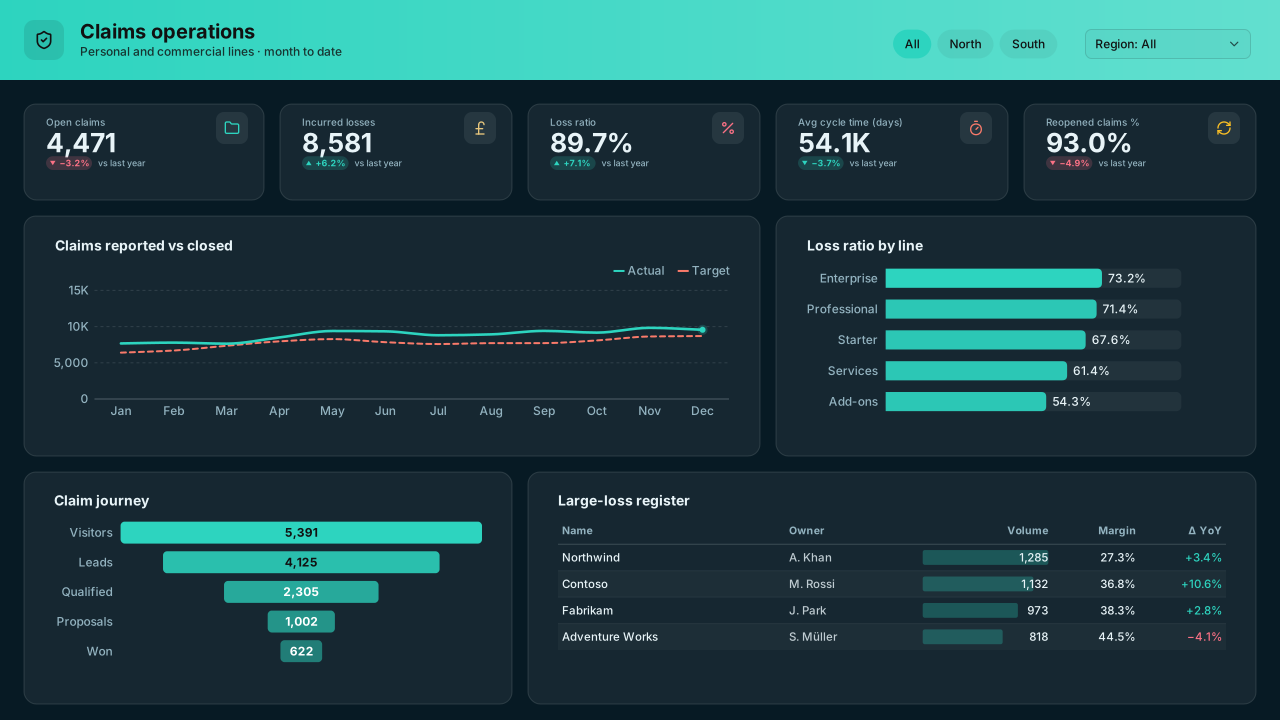 Insurance
 Claims
Gradient band header, 5 KPIs, reported vs closed trend + loss-ratio bars, claim-journey funnel + large-loss registerOcean DeepFree for commercial use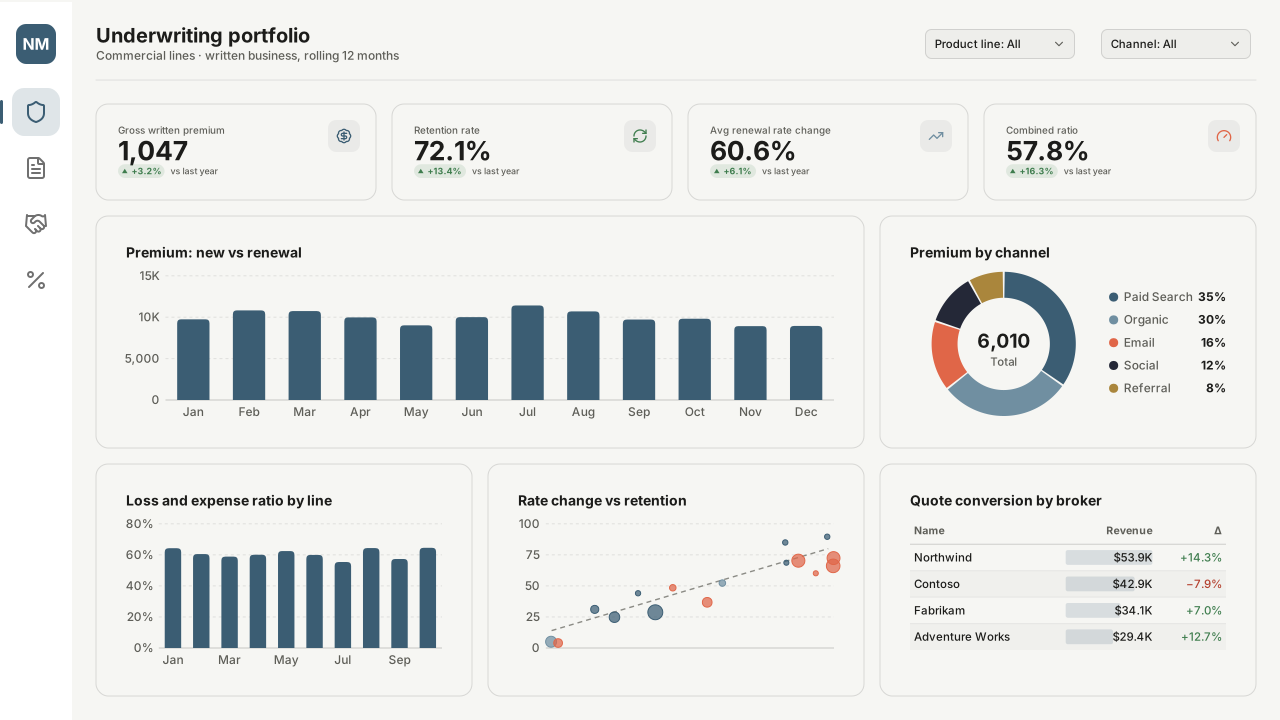 Insurance
 Underwriting Portfolio
Left nav rail, 4 outline KPIs, new-vs-renewal premium + channel donut, ratios + rate/retention scatter + broker tableNordic MinimalFree for commercial use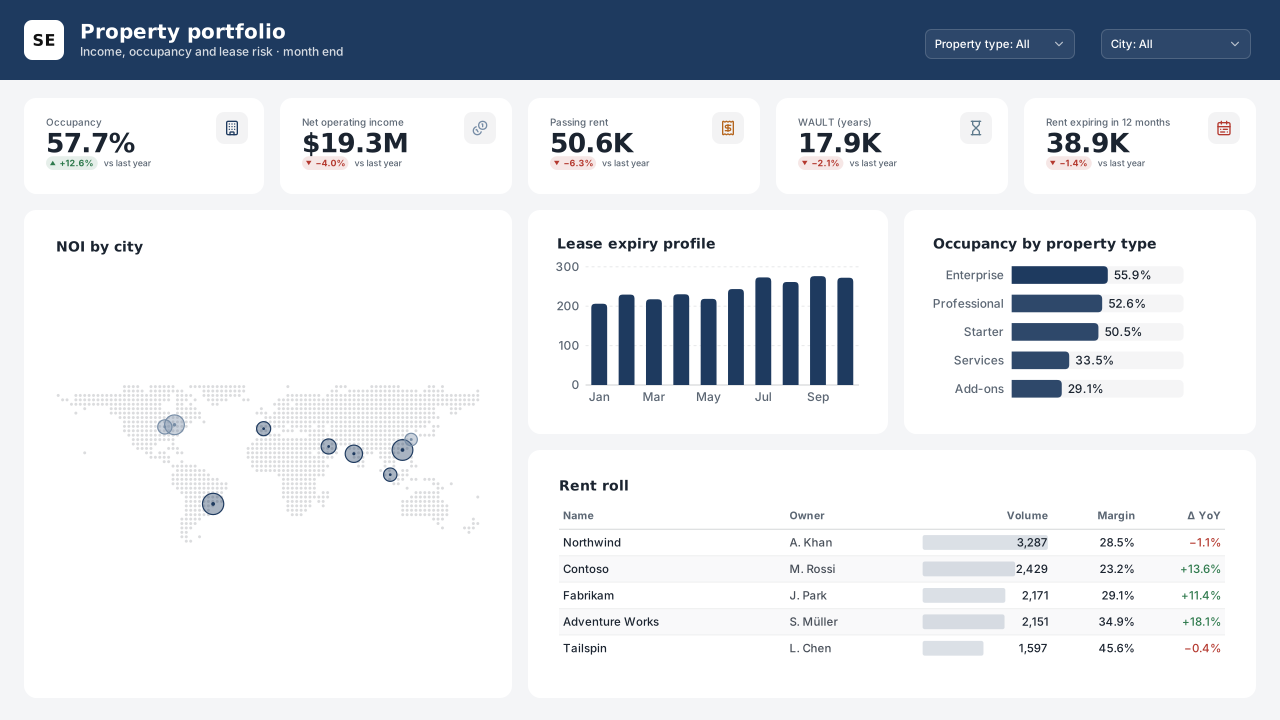 Real estate & workplace
Real Estate Property Portfolio
Header band with logo, 5 KPIs, tall NOI map left, lease-expiry columns + occupancy bars + rent roll rightSlate ExecutiveFree for commercial use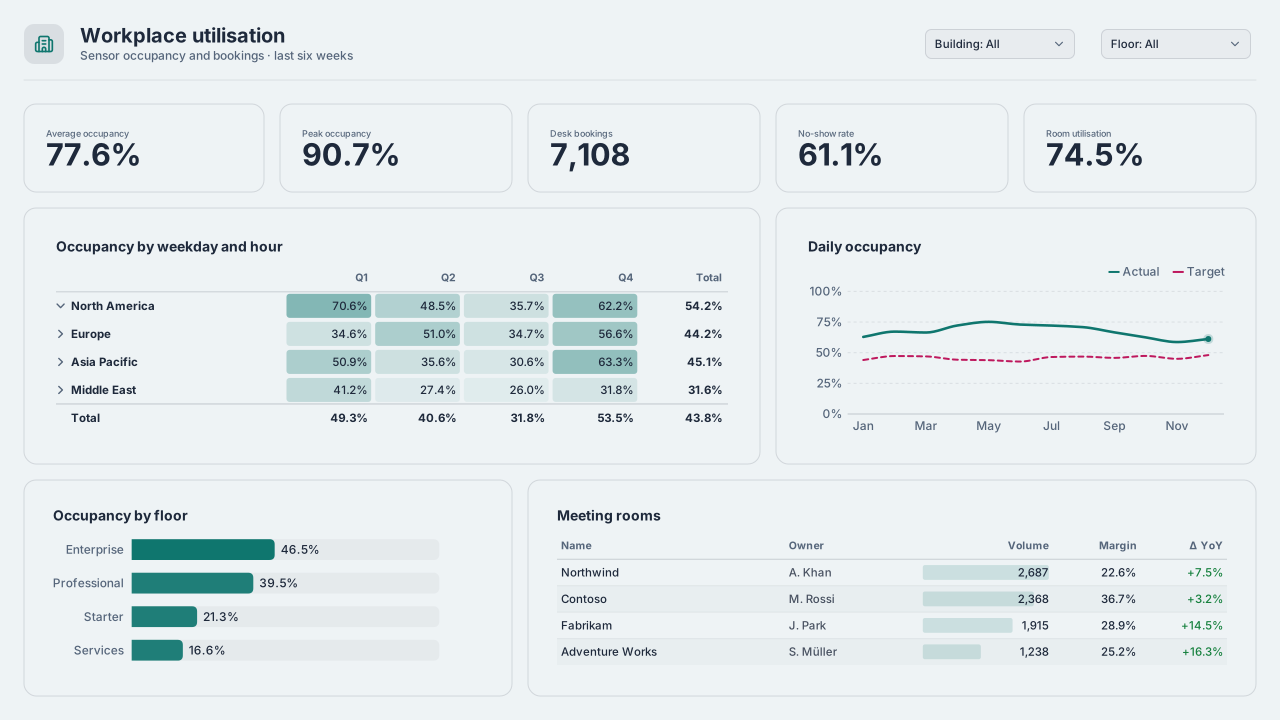 Real estate & workplace
Workplace Space Utilisation
Plain header, 5 slim KPIs, weekday × hour heatmap matrix + daily trend, floor bars + meeting-room tableArctic TealFree for commercial use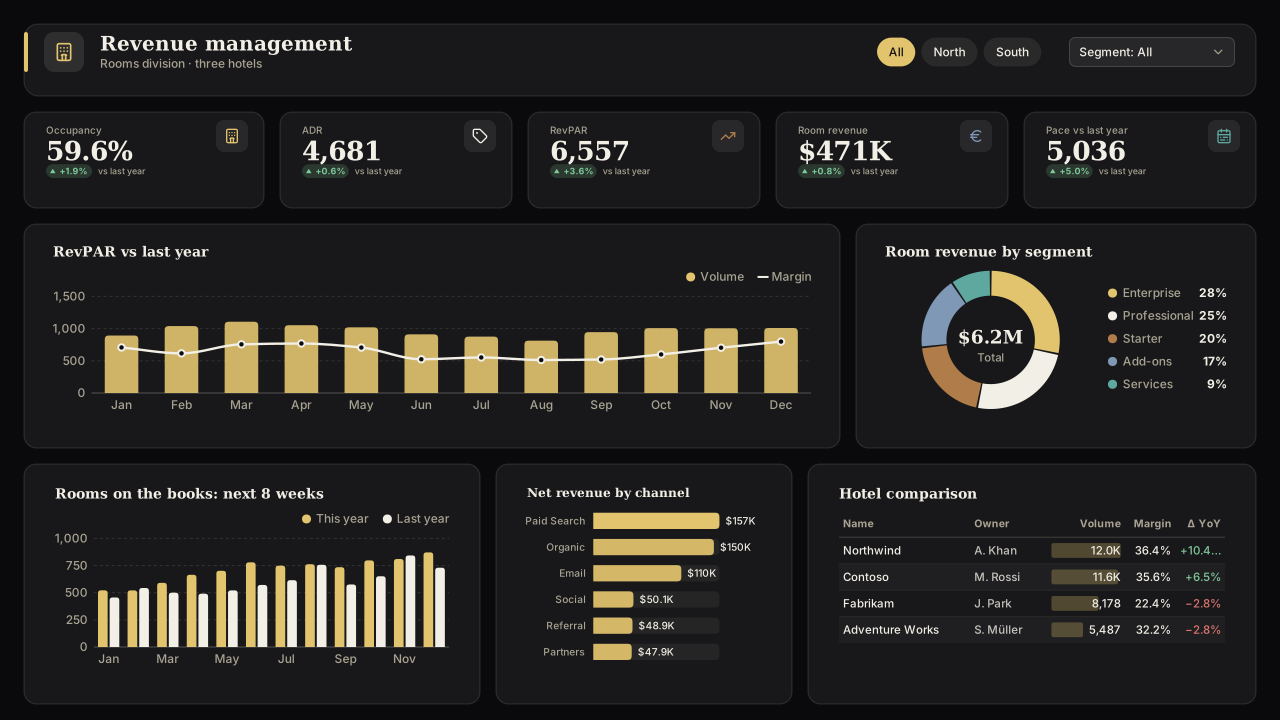 Hospitality
Hotel Revenue Management
Glass header card, 5 glass KPIs, RevPAR combo + segment donut, pace columns + channel bars + hotel tableObsidian GoldFree for commercial use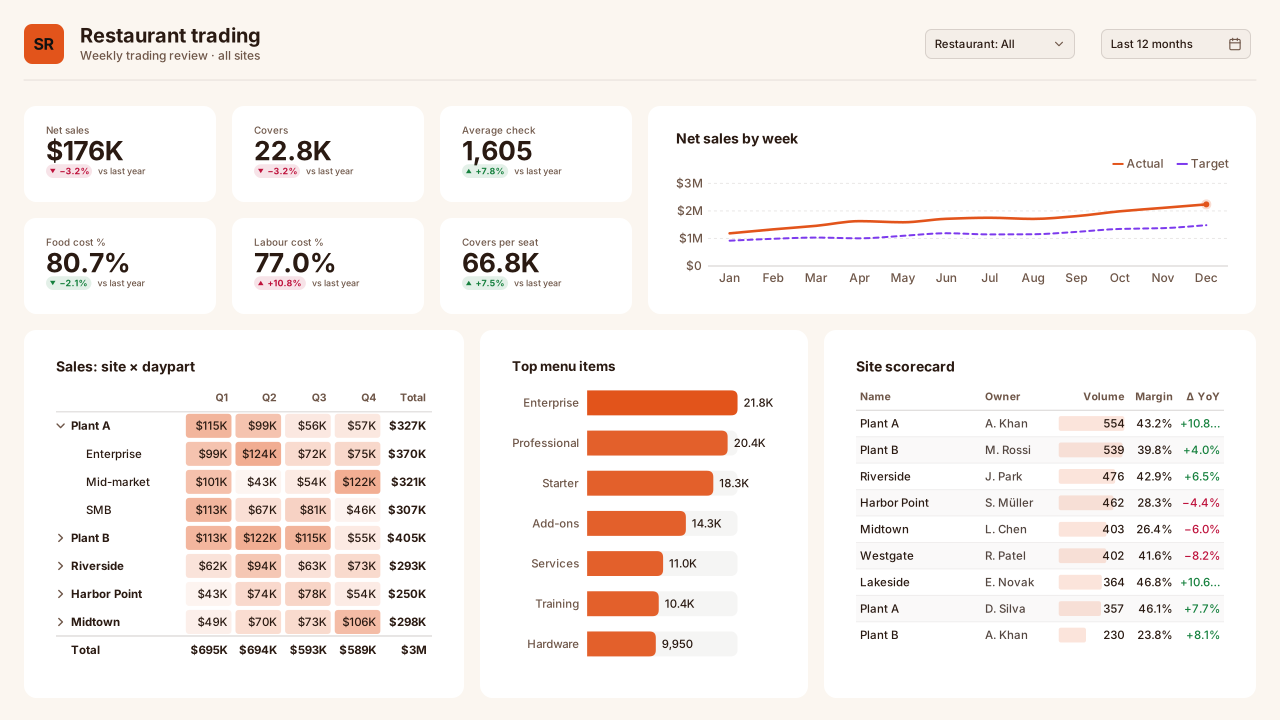 Hospitality
Restaurant Performance
Plain header with logo, 3×2 KPI block beside a weekly trend, site × daypart matrix + top dishes + site scorecardSunset RetailFree for commercial use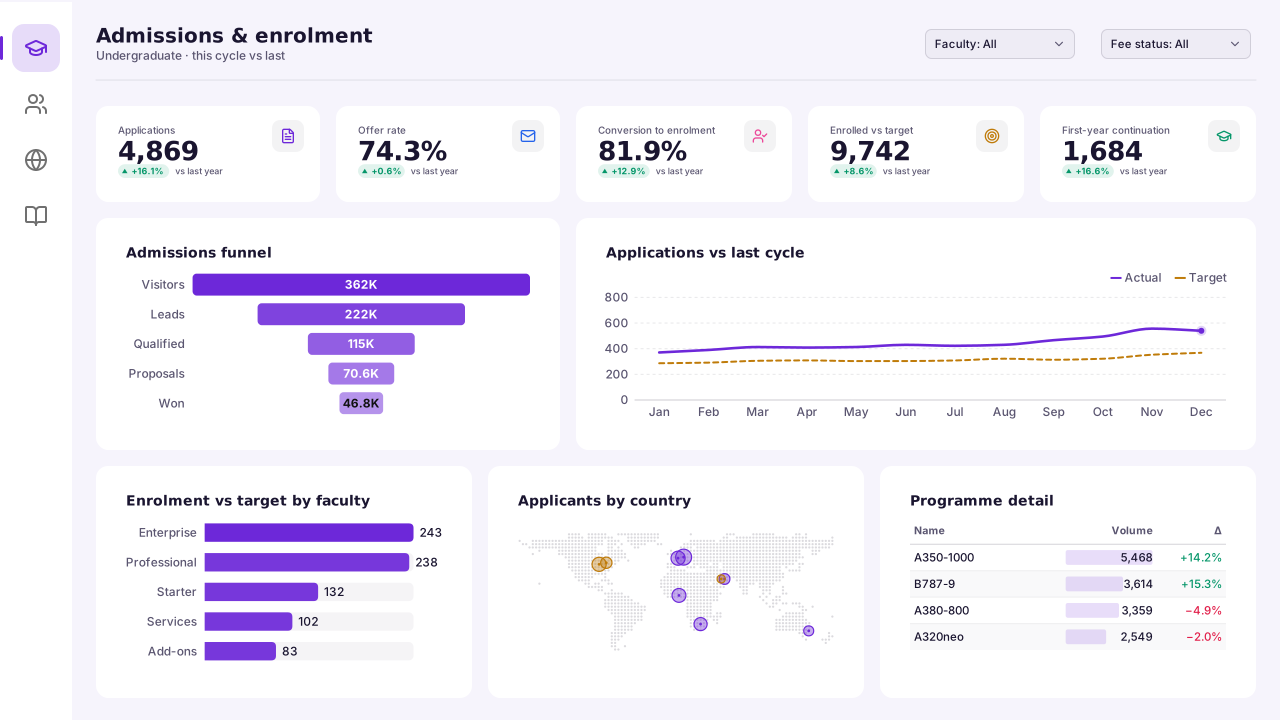 Education
University Admissions & Enrolment
Left nav rail, 5 KPIs, funnel + cycle-on-cycle trend, faculty bars + country map + programme tableLavender SaaSFree for commercial use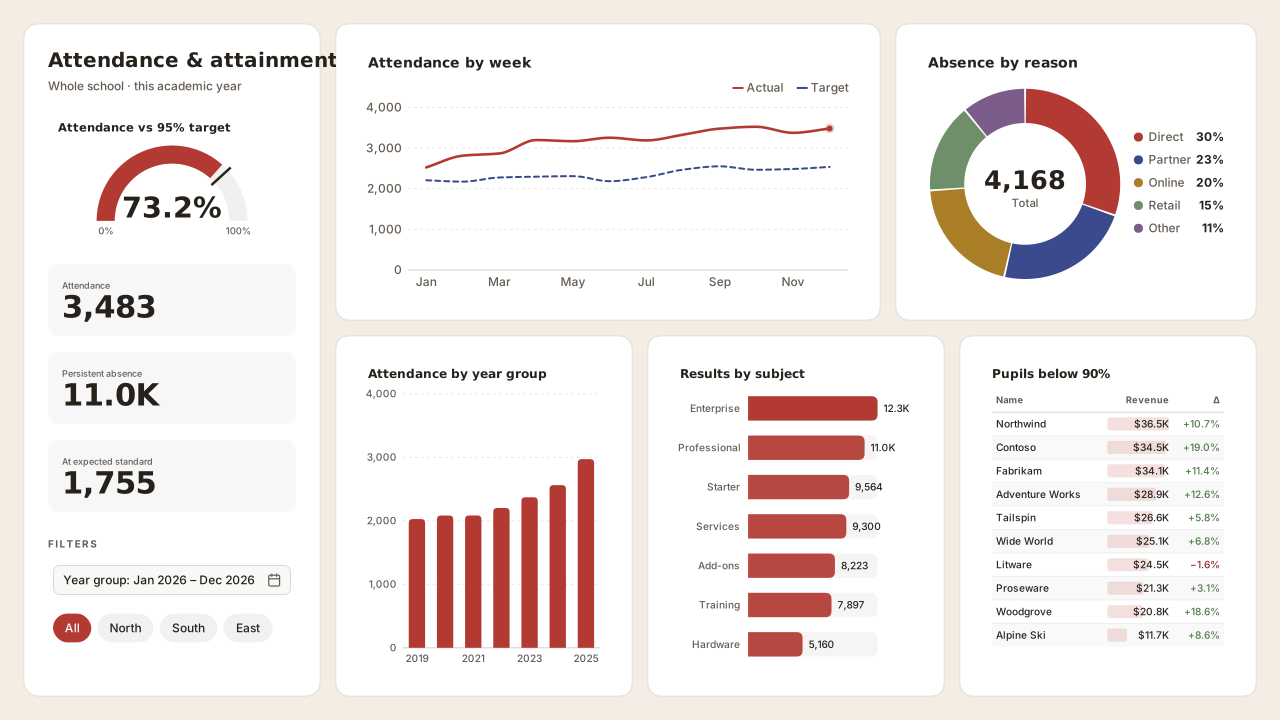 Education
School Attendance & Attainment
Side panel with gauge, 3 KPIs and slicers; weekly trend + absence donut, year-group + subject charts + follow-up listPaper & ClayFree for commercial use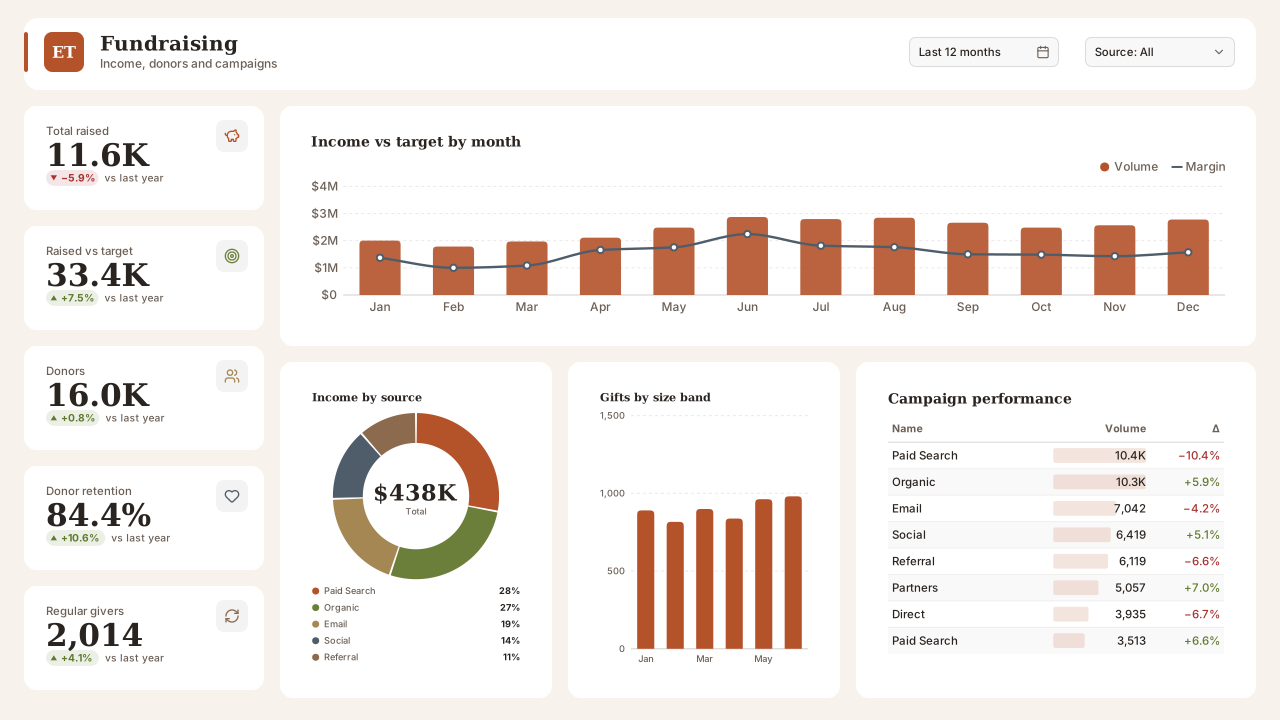 Nonprofit
 Fundraising
Logo header card, left column of 5 KPIs, income vs target combo, source donut + gift bands + campaign tableEarth TonesFree for commercial use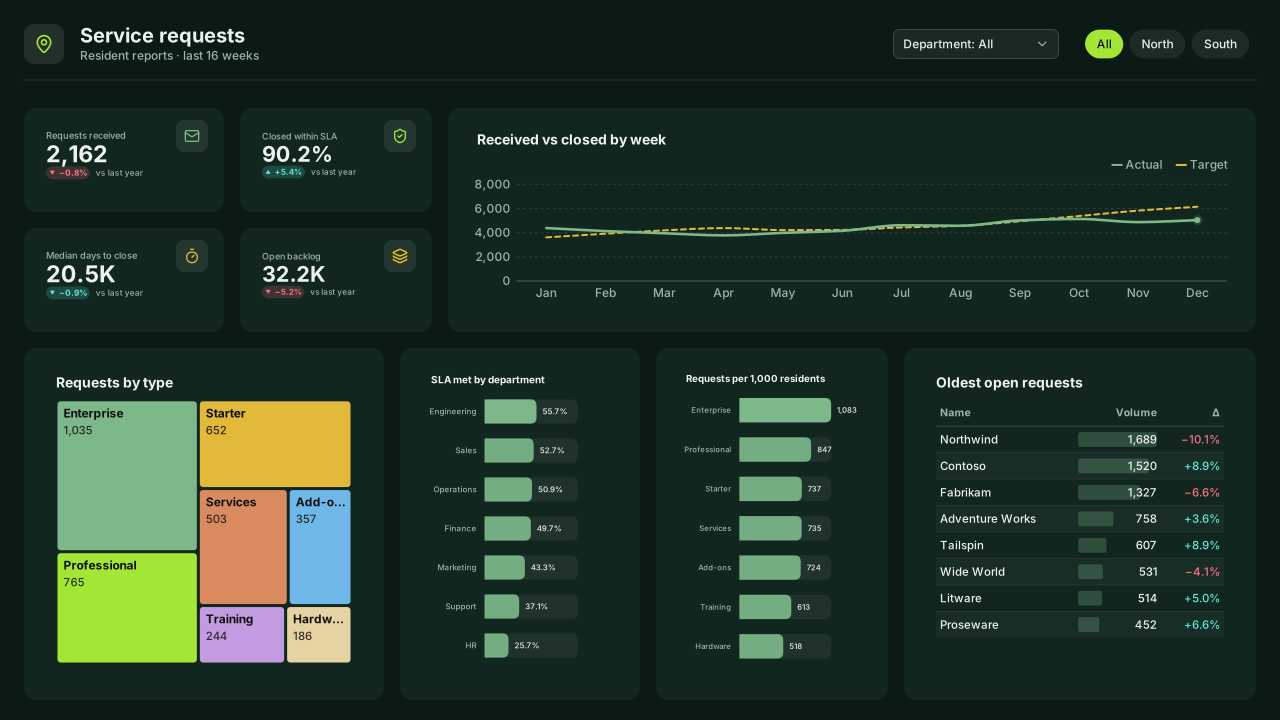 Public sector
City Service Requests (311)
Plain header, 4 KPIs beside a received-vs-closed trend, request-type treemap + 2 bar charts + oldest-open tableForest NightFree for commercial use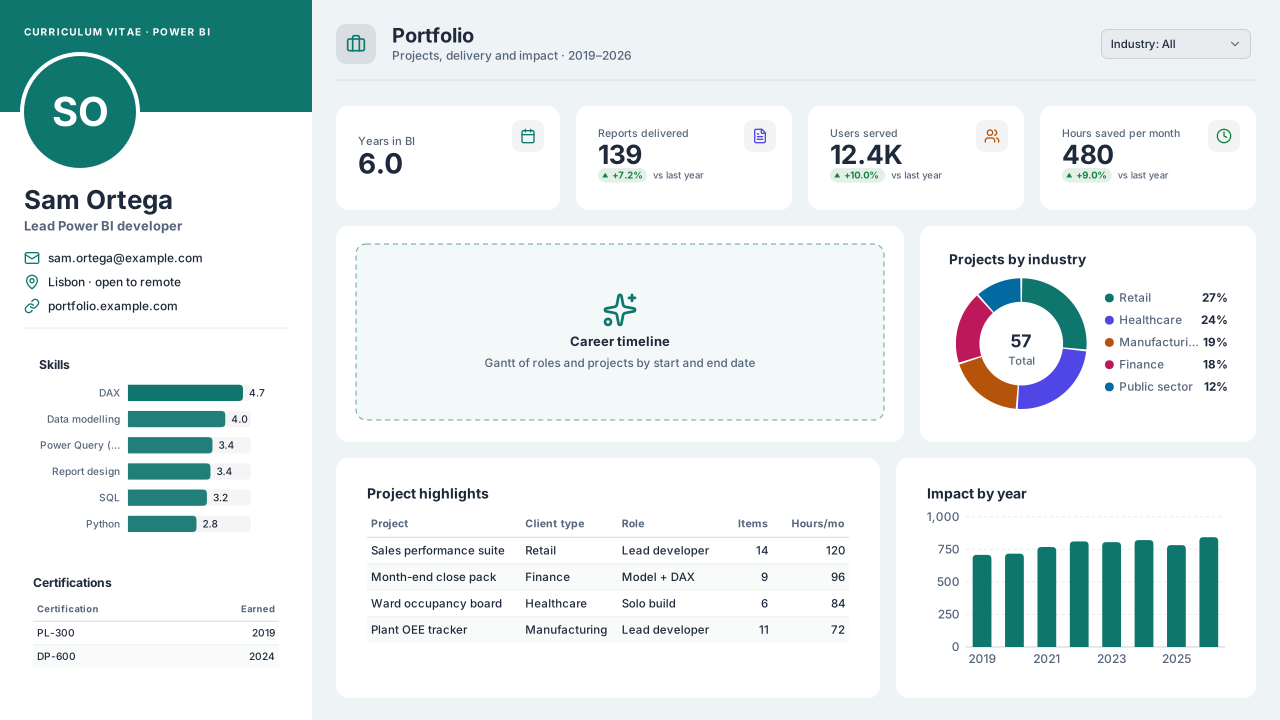 CV & portfolio
CV & Portfolio
Profile sidebar with skills + certifications, 4 impact KPIs, timeline + industry split, projects table + yearly impactArctic TealFree for commercial use
Templates by department
Every template, grouped by the team that owns the report. One example per department, with what the layouts share: Power BI examples 2026.
- Executive
- Board and leadership scorecards: a few headline KPIs against target.
- Executive KPI Scorecard
- Finance
- CFO overviews, P&L statements and budget vs actual pages.
- CFO OverviewProfit & Loss StatementBudget vs ActualAccounts Receivable & CollectionsTravel & Expense ManagementPrice-Volume-Mix Analysis
- Sales
- Pipeline, territory and account performance.
- Regional Sales PerformanceSales PipelineSales Rep Quota Attainment
- Marketing
- Campaign spend, leads, funnels and channel efficiency.
- Marketing Campaign PerformanceWeb Analytics & SEOSocial Media PerformanceEmail Marketing
- Retail & e-commerce
- Store league tables, online conversion and product performance.
- E-commerce PerformanceRetail Store PerformanceRetail Merchandising: Sell-Through
- SaaS
- MRR, churn, retention cohorts and unit economics.
- SaaS Metrics: MRR & ChurnProduct Analytics & Feature Adoption
- Operations
- Contact centres, support desks and energy management.
- Customer SupportCall Centre OperationsEnergy ConsumptionSolar Generation
- HR & people
- Headcount, attrition, hiring and workforce mix.
- HR Headcount & AttritionRecruitment & Hiring FunnelEmployee Engagement SurveyLearning & Training CompliancePayroll, Overtime & Absence
- Supply chain
- Inventory, logistics and procurement spend.
- Supply Chain InventoryLogistics & DeliveryProcurement Spend AnalysisWarehouse OperationsFleet ManagementSupplier Performance ScorecardDemand Forecast Accuracy
- Manufacturing
- OEE, downtime and quality on the plant floor.
- Manufacturing OEEManufacturing Quality ControlMaintenance & Asset Reliability
- Healthcare
- Patient flow, bed occupancy and emergency department performance.
- Healthcare OperationsOutpatient Clinic AppointmentsHealthcare Revenue Cycle
- IT
- Service desk, incidents, SLAs and change.
- IT Service DeskCloud Cost (FinOps)Vulnerability Management
- Project & PMO
- Portfolio status, roadmaps and budget tracking.
- Project PortfolioConstruction Project Controls
- Banking
- Loan book risk, branch performance and card-fraud monitoring.
- Loan Portfolio RiskRetail Banking Branch PerformanceCard Fraud Monitoring
- Insurance
- Claims handling, loss ratios and underwriting portfolios.
- Insurance ClaimsInsurance Underwriting Portfolio
- Real estate & workplace
- Property portfolios, rent rolls and office space utilisation.
- Real Estate Property PortfolioWorkplace Space Utilisation
- Hospitality
- Hotel revenue management and restaurant performance.
- Hotel Revenue ManagementRestaurant Performance
- Education
- Student admissions, enrolment, attendance and attainment.
- University Admissions & EnrolmentSchool Attendance & Attainment
- Public sector
- Citizen service requests, response times and local services.
- City Service Requests (311)
- CV & portfolio
- Your own work as a report: a Power BI résumé with skills, projects and impact.
- CV & Portfolio
PBIP templates with sample data
Beta. Each download is a Power BI project (PBIP) whose semantic model is written as TMDL, with the sample rows inside each table's Power Query step: no data source, no gateway, no sign-in.
A blank layout tells you where the visuals go; a template with data shows you how the measures behave. Every model here is a small star schema built for its department: a calendar table marked as the date table, one to four dimension tables, one to four fact tables of 3–480 rows, and a Key Measures table whose DAX you can read on the template's page before you download.
The project opens without its data cache, so Power BI Desktop shows the model definition first: select Refresh once and the rows load from Power Query. Save it as a .pbix with File → Save as, or replace each table's Source step with your own data and keep the column names.
| Template | Sample data | Tables | Rows | Measures |
|---|---|---|---|---|
| Executive KPI Scorecard | Performance | 3 | 96 | 9 |
| CFO Overview | GL, Cash Forecast | 5 | 436 | 8 |
| Profit & Loss Statement | Ledger | 4 | 360 | 10 |
| Budget vs Actual | Spend, Plan | 6 | 720 | 7 |
| Accounts Receivable & Collections | Invoices, AR Snapshot | 6 | 276 | 7 |
| Travel & Expense Management | Claims, Travel Budget | 5 | 360 | 7 |
| Price-Volume-Mix Analysis | Sales | 4 | 192 | 10 |
| Regional Sales Performance | Sales | 4 | 288 | 6 |
| Sales Pipeline | Opportunities | 5 | 260 | 7 |
| Sales Rep Quota Attainment | Deals, Quota | 7 | 612 | 8 |
| Marketing Campaign Performance | Campaign Weekly | 4 | 147 | 8 |
| Web Analytics & SEO | Traffic, Landing Pages, Search Queries, Country Sessions | 8 | 318 | 10 |
| Social Media Performance | Followers, Posts | 5 | 344 | 8 |
| Email Marketing | Sends, List Changes | 5 | 176 | 9 |
| E-commerce Performance | Web Daily, Product Weekly | 7 | 528 | 8 |
| Retail Store Performance | Store Sales, Store Traffic | 5 | 462 | 5 |
| Retail Merchandising: Sell-Through | Receipts, Style Week | 4 | 390 | 10 |
| SaaS Metrics: MRR & Churn | MRR, Cohorts | 5 | 240 | 12 |
| Product Analytics & Feature Adoption | Daily Usage, Feature Usage, Activation, Retention | 9 | 519 | 8 |
| Customer Support | Tickets | 6 | 420 | 8 |
| Call Centre Operations | Interval Stats | 5 | 480 | 10 |
| Energy Consumption | Readings | 5 | 459 | 6 |
| Solar Generation | Daily Generation, Hourly Profile, Inverter Availability, Energy Losses | 9 | 282 | 8 |
| HR Headcount & Attrition | Employees, Requisitions | 6 | 366 | 9 |
| Recruitment & Hiring Funnel | Candidates | 6 | 450 | 8 |
| Employee Engagement Survey | Responses, eNPS Responses, Invitations | 8 | 576 | 8 |
| Learning & Training Compliance | Assignments | 4 | 480 | 8 |
| Payroll, Overtime & Absence | Payroll, Workforce, Absence | 8 | 720 | 9 |
| Supply Chain Inventory | Stock Weekly | 4 | 480 | 8 |
| Logistics & Delivery | Deliveries, Exceptions | 5 | 447 | 7 |
| Procurement Spend Analysis | Spend | 4 | 378 | 5 |
| Warehouse Operations | Shift Activity, Hourly Picks, Receipts | 7 | 564 | 7 |
| Fleet Management | Vehicle Month, Vehicle Costs | 6 | 480 | 7 |
| Supplier Performance Scorecard | Deliveries | 4 | 420 | 8 |
| Demand Forecast Accuracy | Forecast | 4 | 432 | 9 |
| Manufacturing OEE | Production, Downtime | 6 | 672 | 9 |
| Manufacturing Quality Control | Inspections, Defects, CAPA | 7 | 394 | 9 |
| Maintenance & Asset Reliability | Work Orders, Run Hours | 6 | 544 | 8 |
| Healthcare Operations | ED Hourly, Spells | 6 | 634 | 10 |
| Outpatient Clinic Appointments | Appointments, Clinic Capacity | 6 | 468 | 5 |
| Healthcare Revenue Cycle | Claims, Collection Target | 7 | 438 | 8 |
| IT Service Desk | Incidents, Changes | 6 | 425 | 9 |
| Cloud Cost (FinOps) | Cloud Cost, Team Week, Recommendations | 6 | 485 | 7 |
| Vulnerability Management | Findings, Open Snapshot | 7 | 514 | 7 |
| Project Portfolio | Project Cost | 4 | 181 | 8 |
| Construction Project Controls | Progress, Change Orders, Safety Incidents | 6 | 352 | 11 |
| Airline Operations & Fleet Reliability | Flights, Tech Delays, Removals | 8 | 576 | 9 |
| Loan Portfolio Risk | Exposure, Large Exposures | 5 | 440 | 7 |
| Retail Banking Branch Performance | Branch Month, Account Openings | 5 | 384 | 8 |
| Card Fraud Monitoring | Card Volume, Alerts | 6 | 404 | 7 |
| Insurance Claims | Claims, Earned Premium | 6 | 560 | 9 |
| Insurance Underwriting Portfolio | Policies, Quotes, Underwriting Result | 7 | 516 | 10 |
| Real Estate Property Portfolio | Leases, Property Month | 4 | 302 | 6 |
| Workplace Space Utilisation | Floor Day, Hourly Profile, Room Week | 8 | 360 | 8 |
| Hotel Revenue Management | Room Nights, Room Inventory, Channel Revenue, On the Books | 8 | 528 | 11 |
| Restaurant Performance | Service Sales, Item Sales | 6 | 500 | 8 |
| University Admissions & Enrolment | Admissions, Applicant Origin, Continuation | 8 | 424 | 10 |
| School Attendance & Attainment | Weekly Attendance, Pupil Attendance, Assessment, Absence Sessions | 9 | 650 | 7 |
| Nonprofit Fundraising | Gifts, Income Target | 6 | 552 | 9 |
| City Service Requests (311) | Requests | 5 | 480 | 7 |
| CV & Portfolio | Deliverables, Skills, Certifications, Roles | 7 | 95 | 7 |
How to use a Power BI template
Four steps from template to a finished Power BI page. No custom visuals or add-ins required.
- 1
Pick a template
Choose a layout for your department. Each page lists the sample tables, the DAX measures and which fields each visual is bound to.
- 2
Download or customise
Download the background PNG and theme JSON as they are, or open the template in the design studio to change colours, fonts, logo and layout first.
- 3
Apply in Power BI Desktop
Set the PNG as the page's canvas background (Image fit: Fill) and import the theme via the Design ribbon → Import theme (View → Theme pane in the service).
- 4
Drop in your visuals
Place visuals over the empty panels with transparent backgrounds, or open the PBIP with sample data, where every built-in visual is already placed and bound.
What makes these dashboard designs work
Every layout follows the same rules: the answer to the page's main question sits top-left, KPIs come before charts, and detail tables come last. Panels sit on an 8-pixel grid with 16-pixel gutters, which matches Power BI's own snapping, so visuals line up without nudging.
The decoration (panels, header bands, navigation rails, icons) lives in the page background image, not in shapes on the canvas. That keeps the report fast, because Power BI draws one image instead of dozens of shapes, and it keeps the visuals easy to select.
Colours come from a theme that has been checked for contrast: text meets WCAG AA and data colours clear 3:1 against the cards. If you change the brand in the studio, the same checks run again before export.
Frequently asked questions
Are these Power BI dashboard templates free?
Yes. Every template downloads free, without signing up, as a PBIP project with sample data, a background PNG or SVG and a Power BI theme JSON, and opens in the VizForge design studio. Anonymous exports carry a small “Made with VizForge” mark; signing in removes it.
What do I get when I download a template?
The main download is a PBIP project (beta): the report page with its background, theme and visuals in place, plus a small sample semantic model (tables, a date table, relationships and DAX measures) that every built-in visual is bound to (custom-visual placeholder slots stay empty for a visual you generate). You can also take the page background at 1920×1080 (the Fluent 2 default for new pages), 1280×720 or 2×, the matching theme JSON on its own, or an empty PBIP with unbound visual containers.
How do I use the background image in Power BI Desktop?
Select the page, open Format page → Canvas background, choose Browse and pick the PNG, then set Image fit to Fill and transparency to 0%. Give your visuals a transparent background and no border so the designed panels show through.
Can I open the PBIP project in Power BI Desktop?
Yes. PBIR is the default report format in Power BI Desktop since September 2026, and the download is a PBIP project: unzip it and open the .pbip file, select Refresh once and the sample data loads into visuals that are already bound (the empty PBIP leaves the containers unbound for your own data). Microsoft still lists projects and TMDL as preview features (as of Nov 2026), so if Desktop won't open it, enable them under File → Options and settings → Options → Preview features.
Can I change the colours and fonts?
Open any template in the design studio and switch the brand kit or pick another theme. Panels, text and the theme JSON update together, so the background and your visuals stay consistent.
Looking for the custom visuals a dashboard needs rather than its layout? The dashboard use cases list them job by job, and the team pages group them by the team that owns the report.
Need a chart Power BI doesn’t ship?
Describe it in plain English and VizForge generates a custom visual as a .pbiviz file, with its TypeScript source. In the design studio, hand any visual slot to the AI and the brief carries the slot size and your brand colours. Sankey, Gantt, bullet, waterfall and more: see the visual catalog.
Generate a custom visual with AI · starts free →Keep exploring
80 contrast-checked theme JSON files, light and dark.
Page backgrounds at 1280×720 and 1920×1080 with visual positions.
3,034 icons in 40 categories as SVG, PNG, DAX or theme icon JSON.
Build a theme JSON from your own brand colours.
Design your own Power BI page
Start from any template or a blank canvas at 1920×1080 or 1280×720, apply your brand, and export the background, theme JSON and a PBIP project.
The design studio for Power BI. Free, in your browser, no sign-up.