3 free templates · Retail & e-commerce
Retail and e-commerce dashboard templates for Power BI
Retail & e-commerce templates
Each template downloads as a background image, a theme JSON and a PBIP project; the ones marked with sample data open in Power BI Desktop with bound visuals.
 With sample data
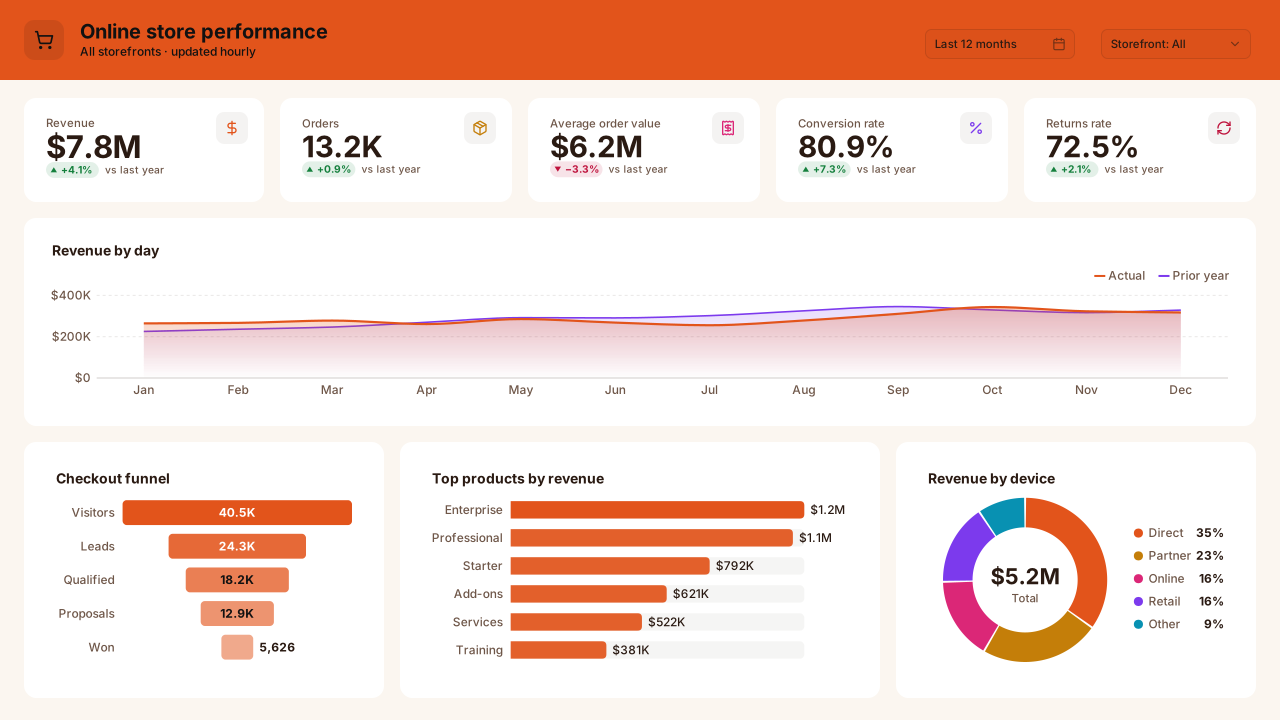
E-commerce Performance
Power BI e-commerce dashboard template: revenue, orders, AOV, conversion and returns KPIs, daily revenue trend, checkout funnel and top products.Free for commercial use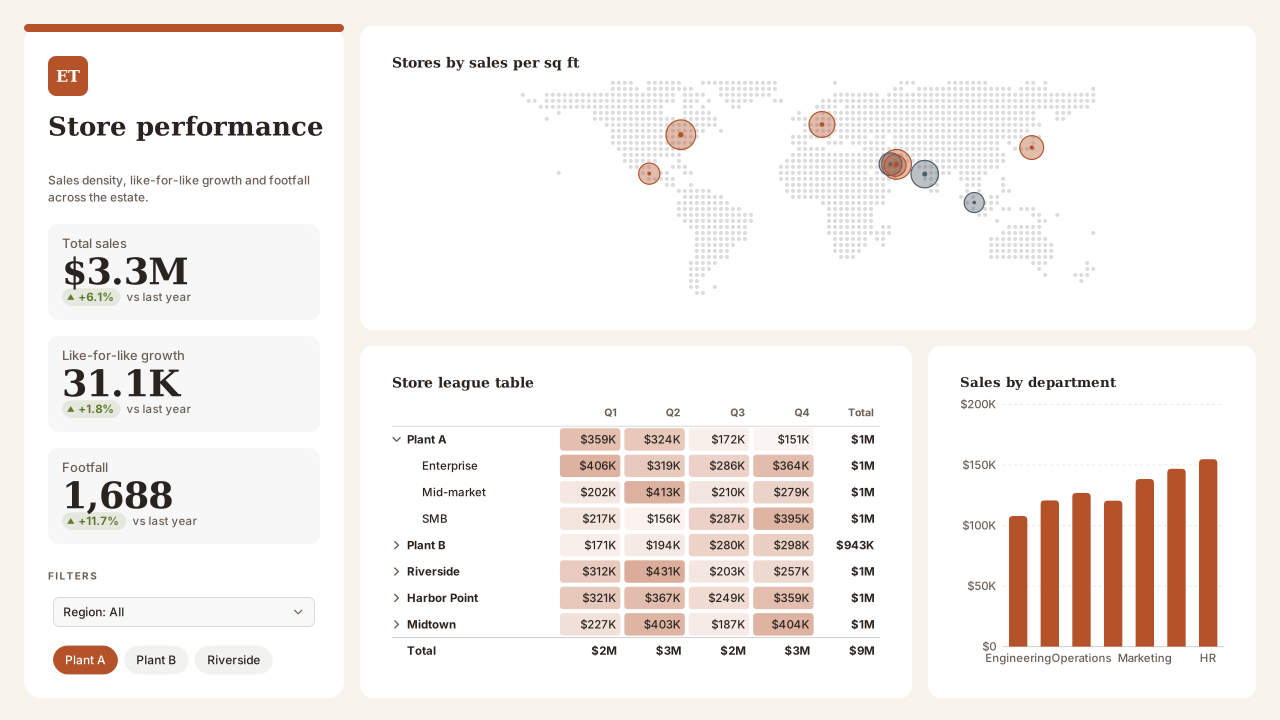 With sample data
Retail Store Performance
Power BI retail store dashboard template with a side story panel, store map by sales density, store league table and department sales.Free for commercial use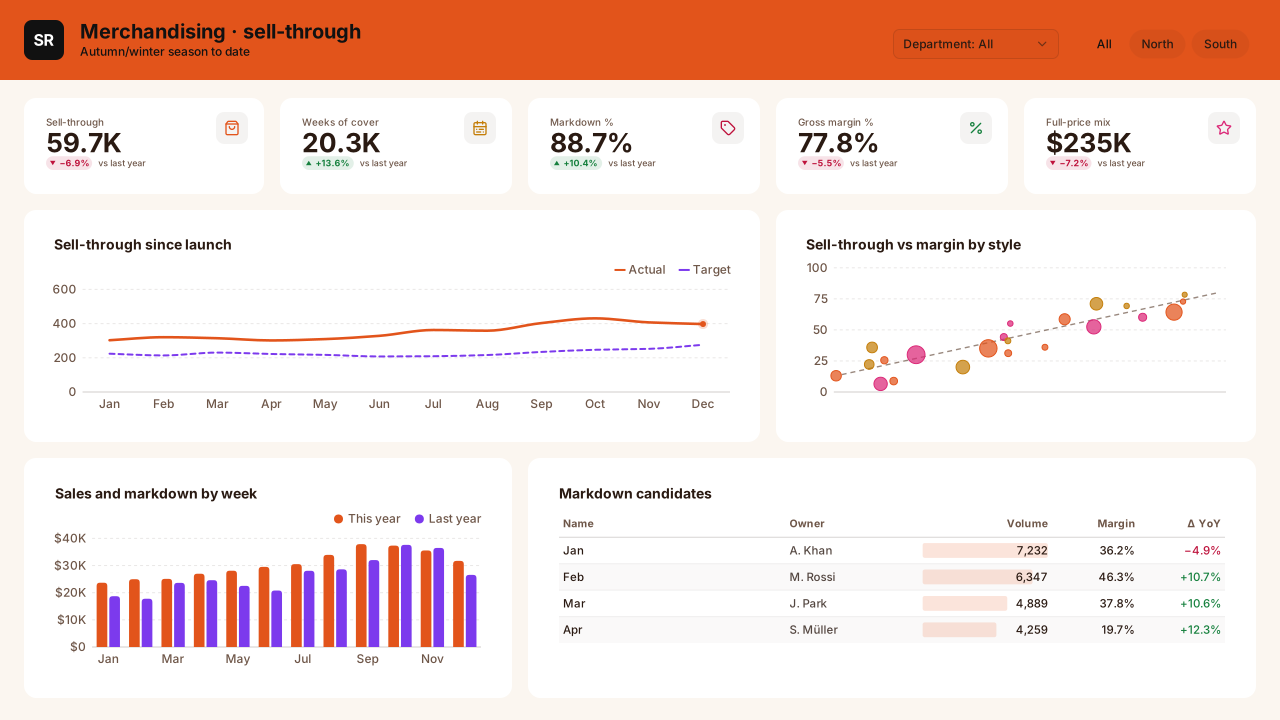 With sample data
Retail Merchandising: Sell-Through
Power BI merchandising dashboard template: sell-through since launch, weeks of cover, markdown and margin by style, and a ranked list of markdown candidates.Free for commercial use
More retail & e-commerce layouts are on the way. Browse all templates or start from a blank page in the Design Studio.
What a retail & e-commerce dashboard should answer
- How did this week trade against last year and plan?
- Which stores and categories drove the difference?
- How does online conversion move through the funnel?
- Which products carry the margin?
Layout advice
Make the comparison period explicit in every title (vs LY, vs plan). League tables should carry rank, value and variance in fixed columns so a store's row reads the same every week.
Check any layout with the Design Check in the Design Studio (contrast, grid, gutters), and pick a contrast-checked theme to match.
Beyond the template
Custom visuals and dashboard recipes for the same team.
Team hub
Power BI visuals for RetailStore league tables, category Paretos and the weekly trading calendar: retail views that make a Monday trading meeting short.
Dashboard recipe
Best Power BI Visuals for Retail AnalyticsThe best Power BI visuals for retail analytics — store heatmaps, category Pareto, basket Sankeys, promotional…
Templates for other departments
- Executive 1
- Finance 6
- Sales 3
- Marketing 4
- SaaS 2
- Operations 4
- HR & people 5
- Supply chain 7
- Manufacturing 3
- Healthcare 3
- IT 3
- Project & PMO 2
- Aviation 1
- Banking 3
- Insurance 2
- Real estate & workplace 2
- Hospitality 2
- Education 2
- Nonprofit 1
- Public sector 1
- CV & portfolio 1
Keep exploring
61 hand-designed Power BI page layouts by department.
80 contrast-checked theme JSON files, light and dark.
Page backgrounds at 1280×720 and 1920×1080 with visual positions.
3,034 icons in 40 categories as SVG, PNG, DAX or theme icon JSON.
Make a retail & e-commerce page your own
Open a template in the Design Studio to change colours, fonts, logo and layout, then export the background, theme JSON and PBIP project.
The design studio for Power BI. Free, in your browser, no sign-up.