2 free templates · Hospitality
Hospitality dashboard templates for Power BI
Hospitality templates
Each template downloads as a background image, a theme JSON and a PBIP project; the ones marked with sample data open in Power BI Desktop with bound visuals.
 With sample data
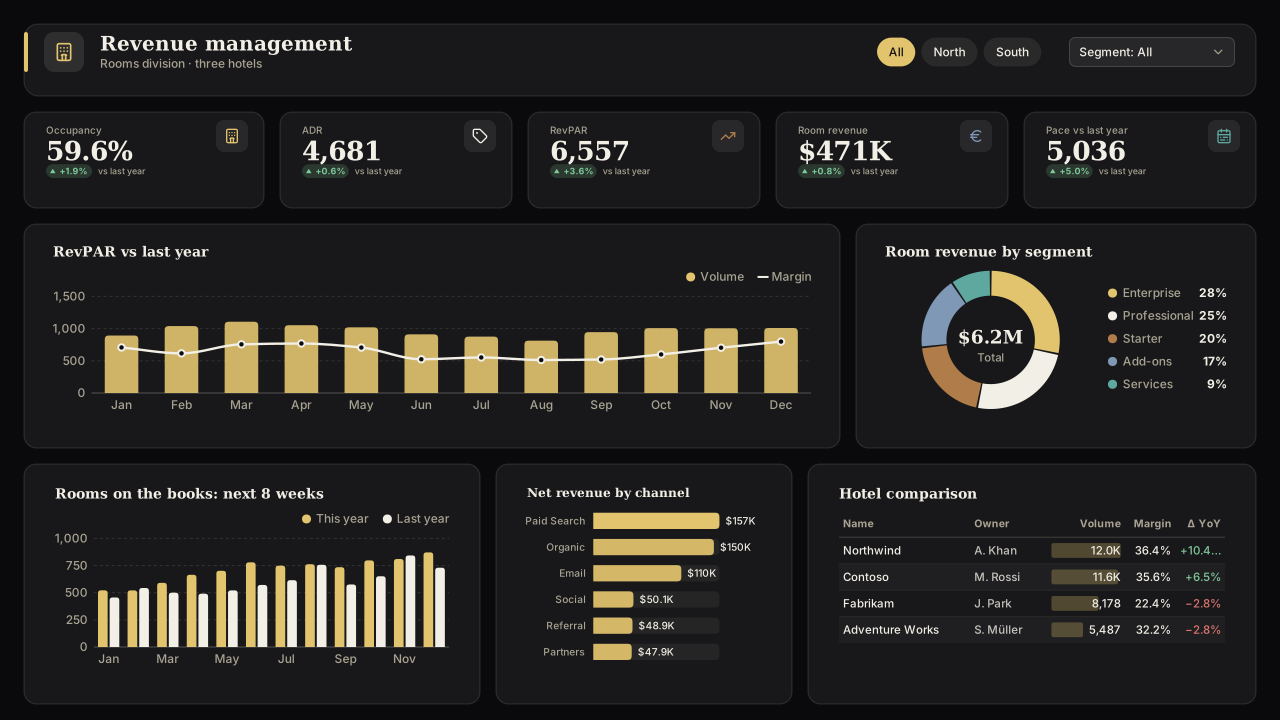
Hotel Revenue Management
Dark Power BI hotel dashboard template: occupancy, ADR and RevPAR vs last year, segment mix, booking pace for the next 8 weeks and net revenue by channel.Free for commercial use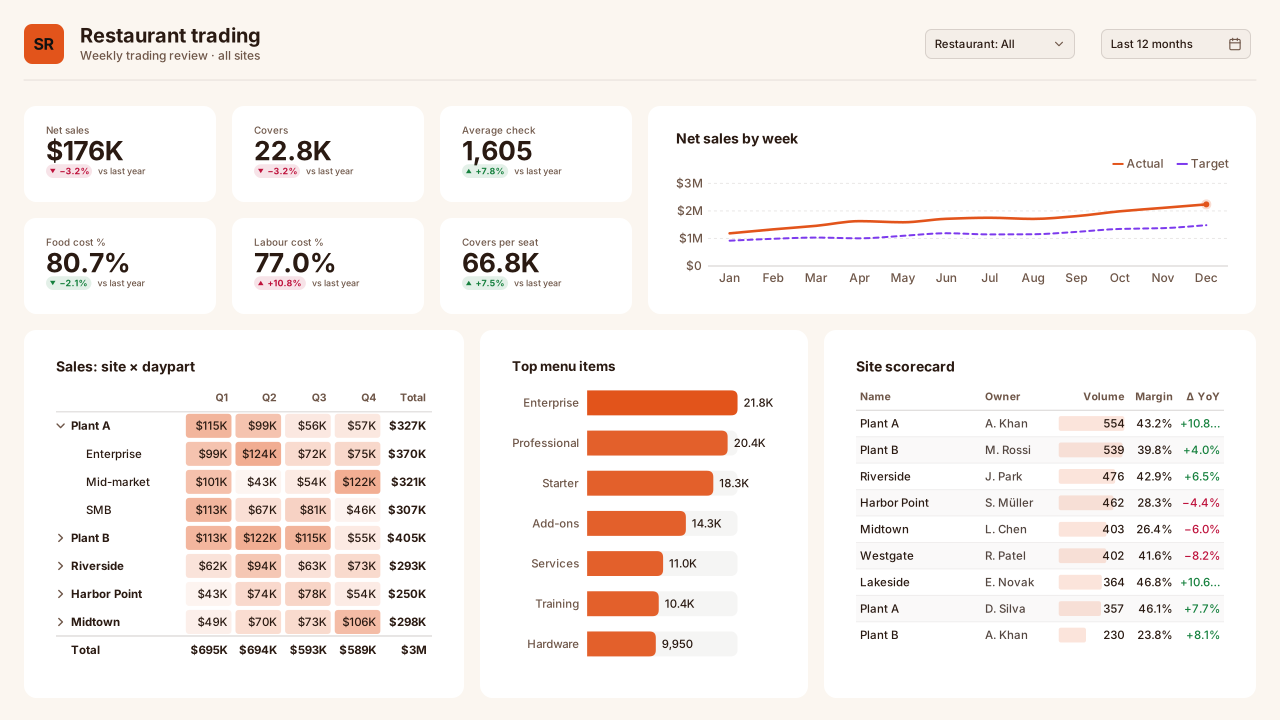 With sample data
Restaurant Performance
Power BI restaurant dashboard template: net sales, covers, average check, food and labour cost %, sales by site and daypart, top dishes and site scorecard.Free for commercial use
More hospitality layouts are on the way. Browse all templates or start from a blank page in the Design Studio.
What a hospitality dashboard should answer
- How do occupancy, ADR and RevPAR compare with the same night last year?
- Which booking channels bring the most profitable stays?
- How many covers per seat does each service turn?
- Is labour cost in line with sales by day part?
Layout advice
Compare like with like: line up each date against the same weekday last year rather than the same calendar date. Keep rooms and food and drink on separate pages because their drivers and units differ.
Check any layout with the Design Check in the Design Studio (contrast, grid, gutters), and pick a contrast-checked theme to match.
Templates for other departments
- Executive 1
- Finance 6
- Sales 3
- Marketing 4
- Retail & e-commerce 3
- SaaS 2
- Operations 4
- HR & people 5
- Supply chain 7
- Manufacturing 3
- Healthcare 3
- IT 3
- Project & PMO 2
- Aviation 1
- Banking 3
- Insurance 2
- Real estate & workplace 2
- Education 2
- Nonprofit 1
- Public sector 1
- CV & portfolio 1
Keep exploring
61 hand-designed Power BI page layouts by department.
80 contrast-checked theme JSON files, light and dark.
Page backgrounds at 1280×720 and 1920×1080 with visual positions.
3,034 icons in 40 categories as SVG, PNG, DAX or theme icon JSON.
Make a hospitality page your own
Open a template in the Design Studio to change colours, fonts, logo and layout, then export the background, theme JSON and PBIP project.
The design studio for Power BI. Free, in your browser, no sign-up.