Yearly roundup · 2026
Power BI examples 2026
One example per department
The first catalog layout for each department. Each card links to the full template with its KPI list, measures and downloads.
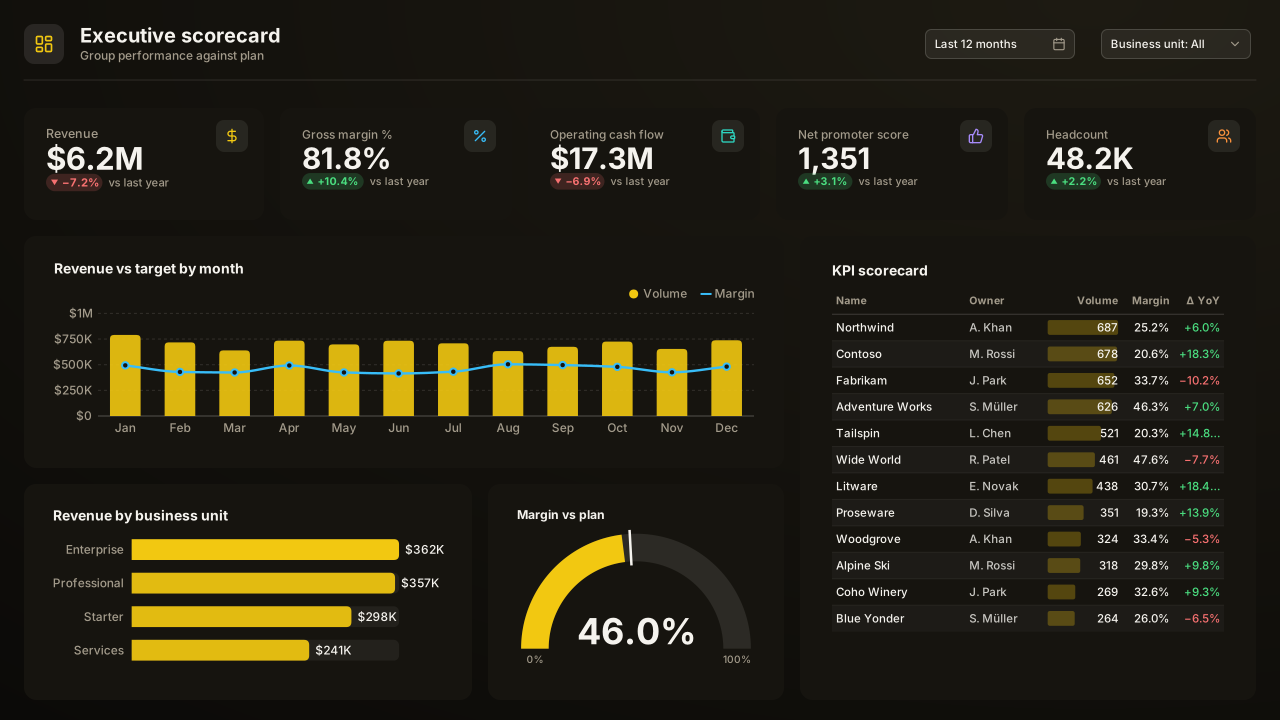 Executive
 KPI Scorecard
Free Power BI executive dashboard template: five headline KPIs, revenue vs target trend, unit breakdown and a scorecard table on one 16:9 page.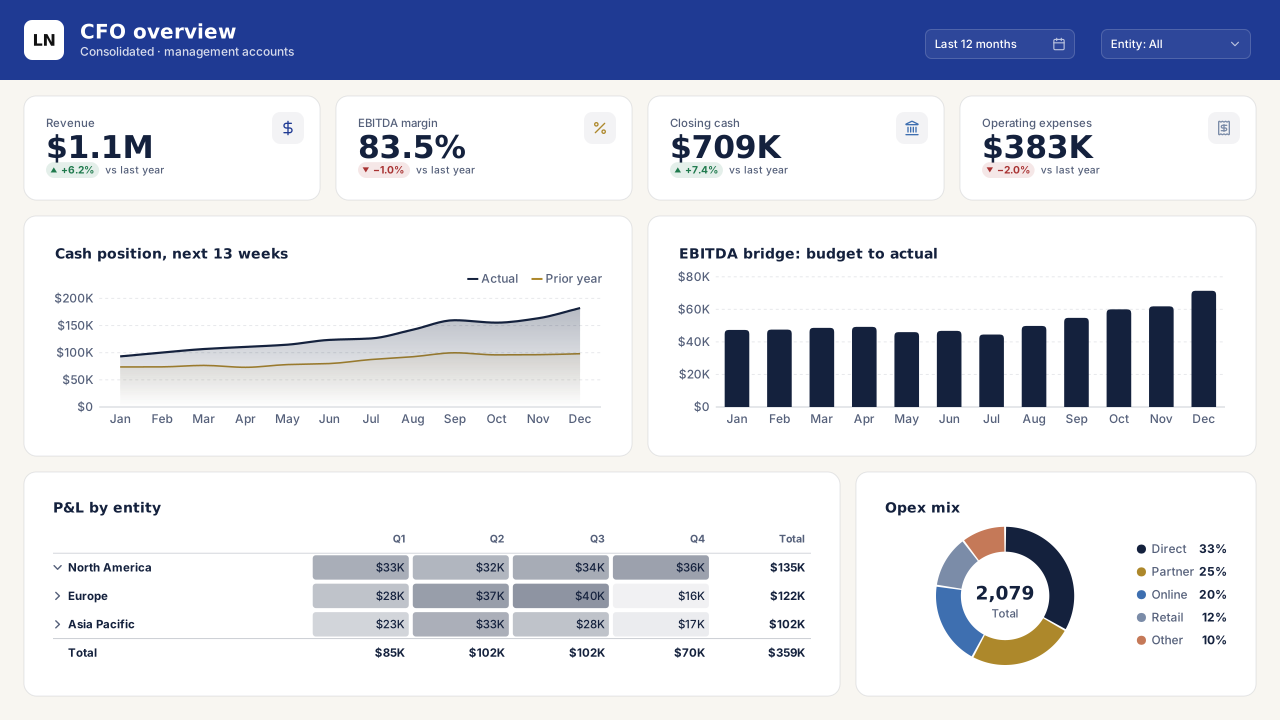 Finance
CFO Overview
Power BI CFO dashboard template with revenue, EBITDA, cash and opex KPIs, a 13-week cash view, EBITDA bridge, P&L matrix and opex mix.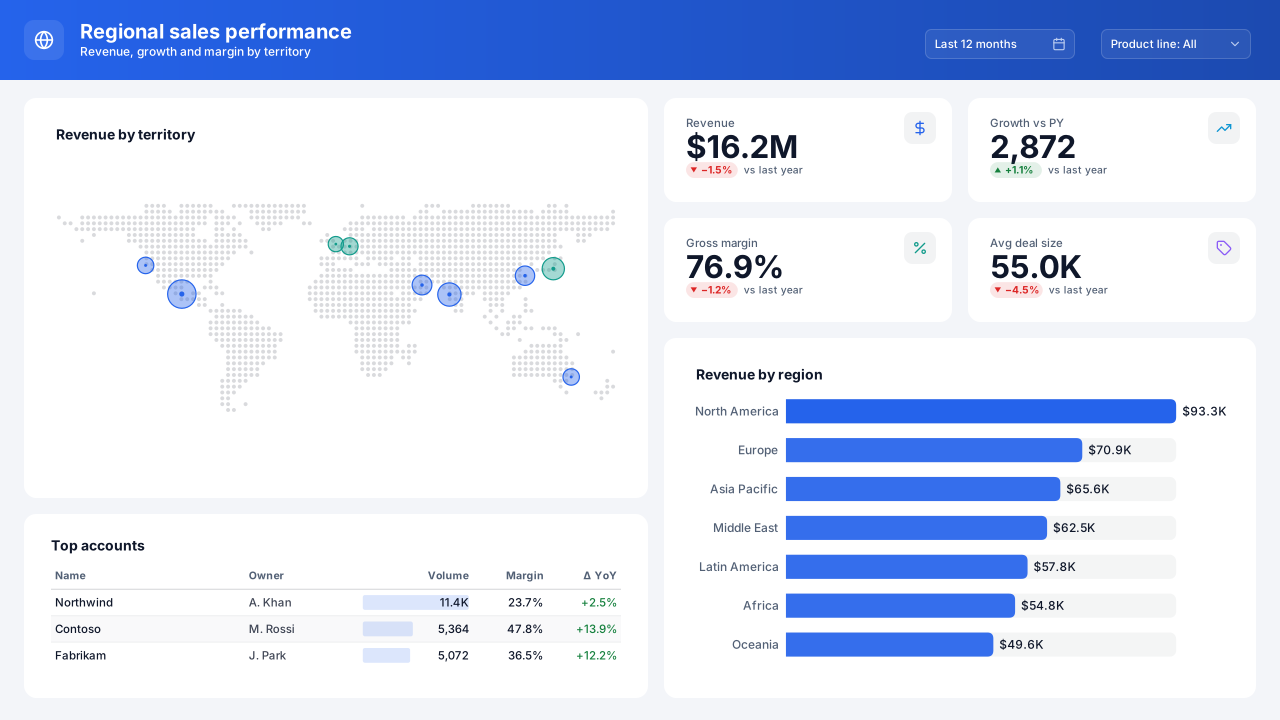 Sales
Regional Sales Performance
Power BI regional sales dashboard template: a large sales map, four KPIs, revenue by region bars and a top-accounts table on one page.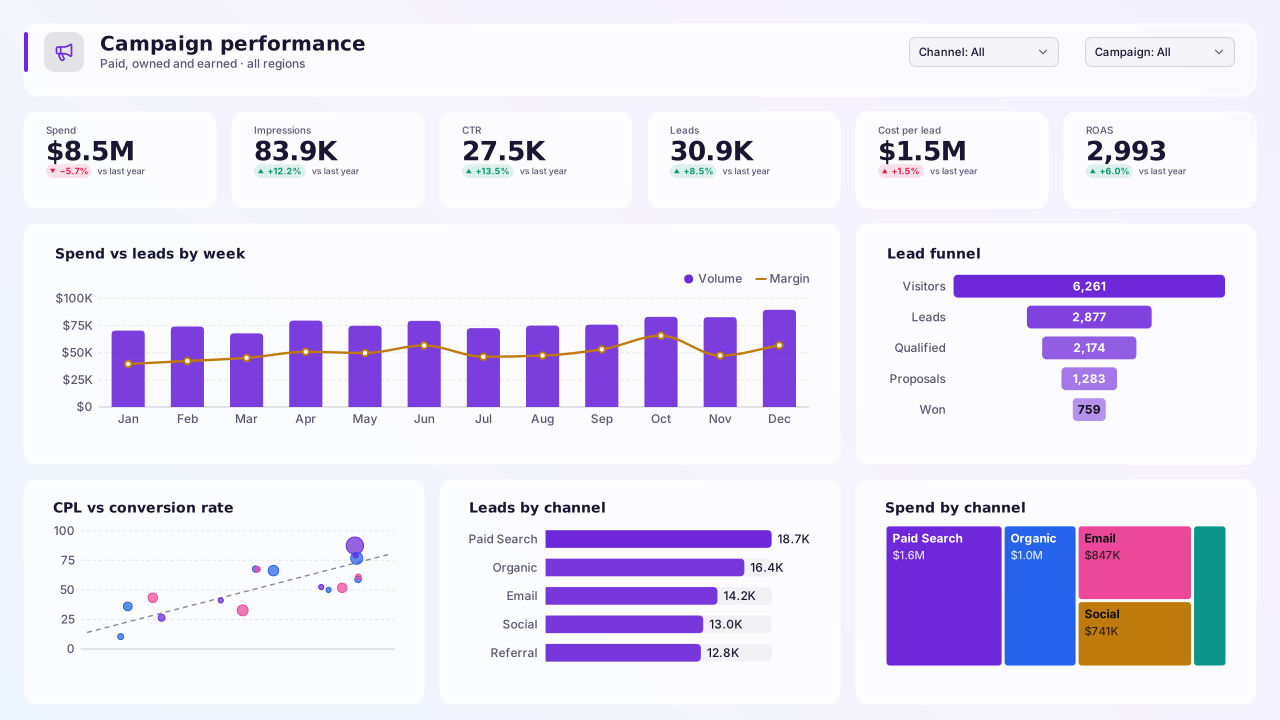 Marketing
 Campaign Performance
Power BI marketing dashboard template: spend, CTR, leads, CPL and ROAS KPIs, spend vs leads trend, lead funnel and channel efficiency charts.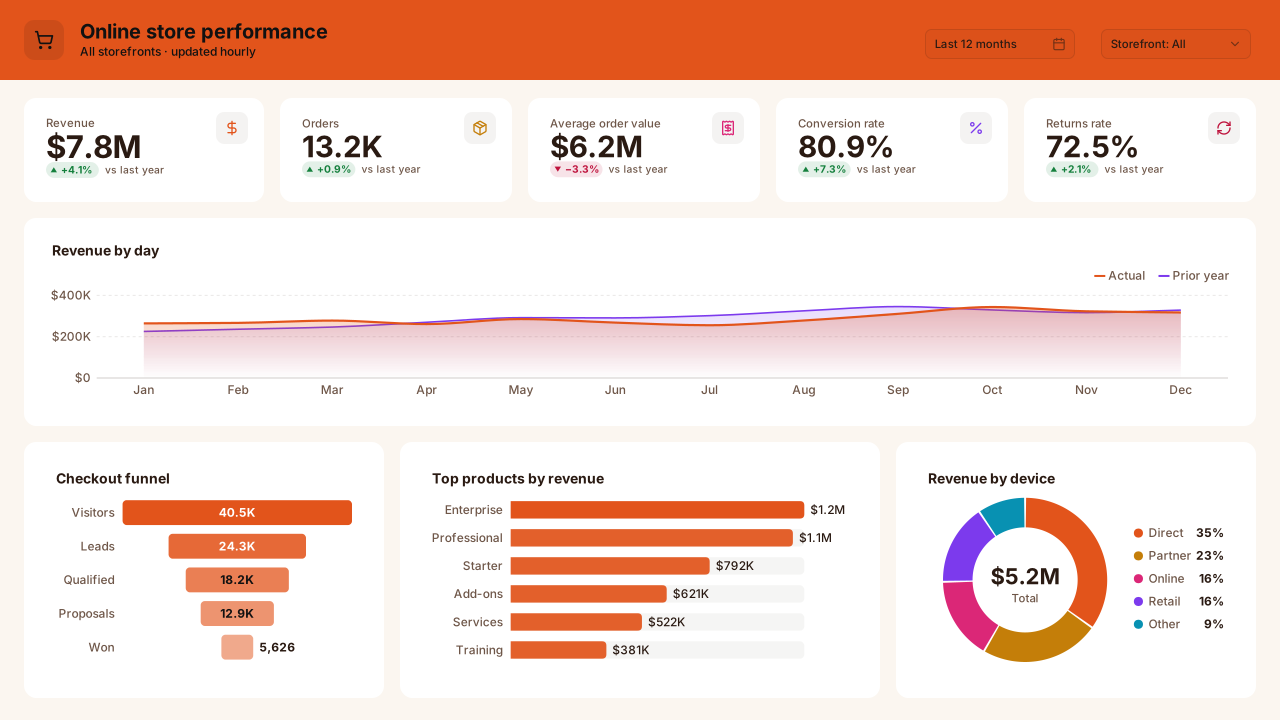 Retail & e-commerce
E-commerce Performance
Power BI e-commerce dashboard template: revenue, orders, AOV, conversion and returns KPIs, daily revenue trend, checkout funnel and top products.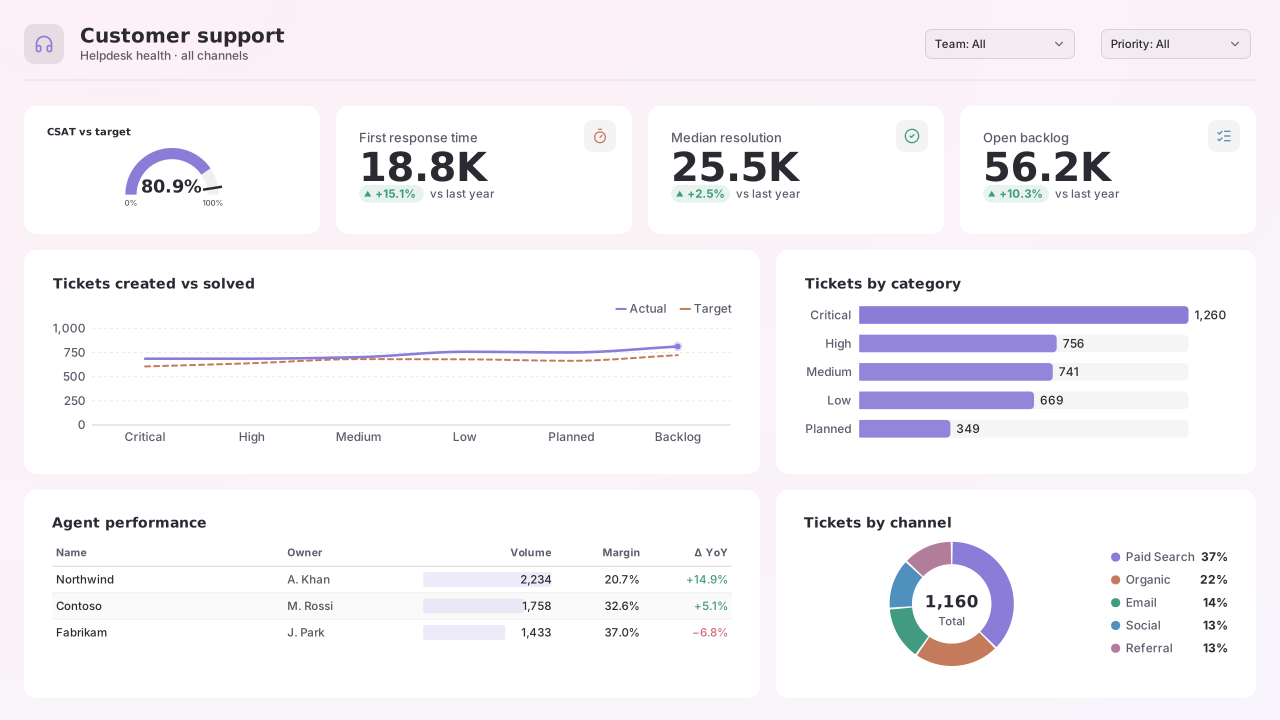 Operations
Customer Support
Power BI customer support dashboard template: CSAT gauge, response and resolution time KPIs, created vs solved trend, ticket categories and agent table.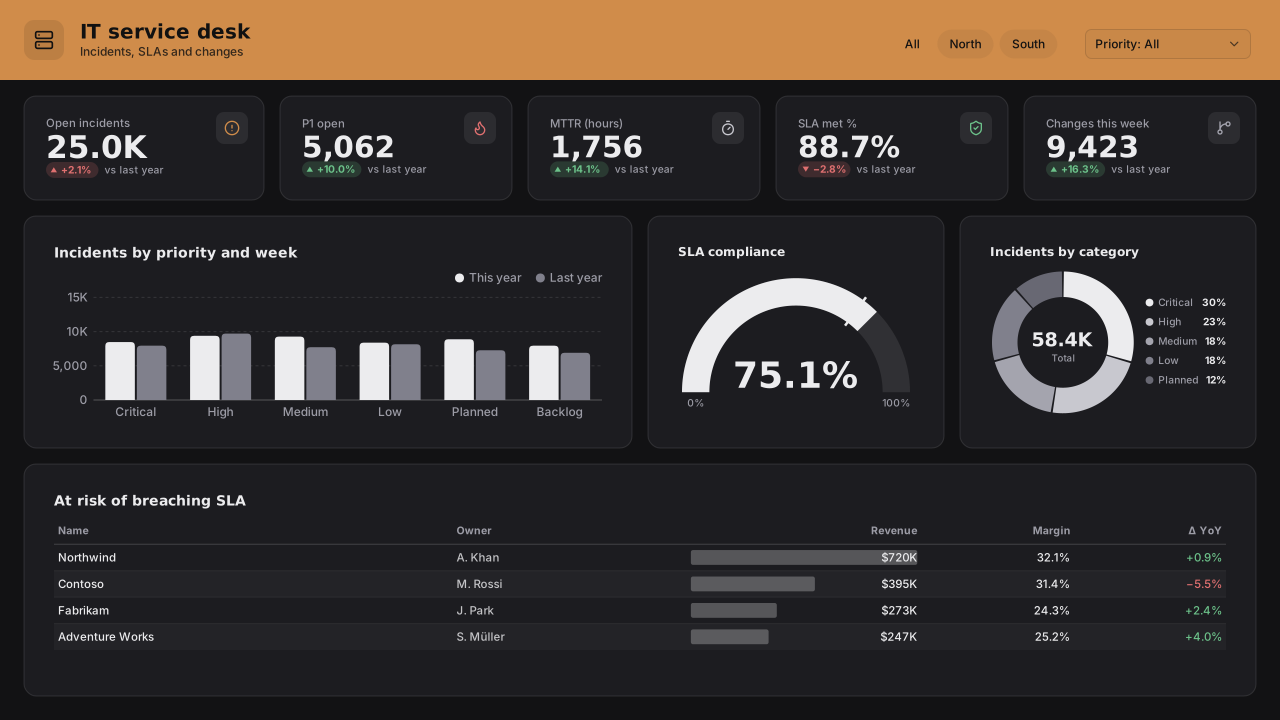 IT
IT Service Desk
Power BI IT service desk dashboard template (ITSM): open incidents, P1s, MTTR and SLA KPIs, incident trend by priority, SLA gauge and breach-risk table.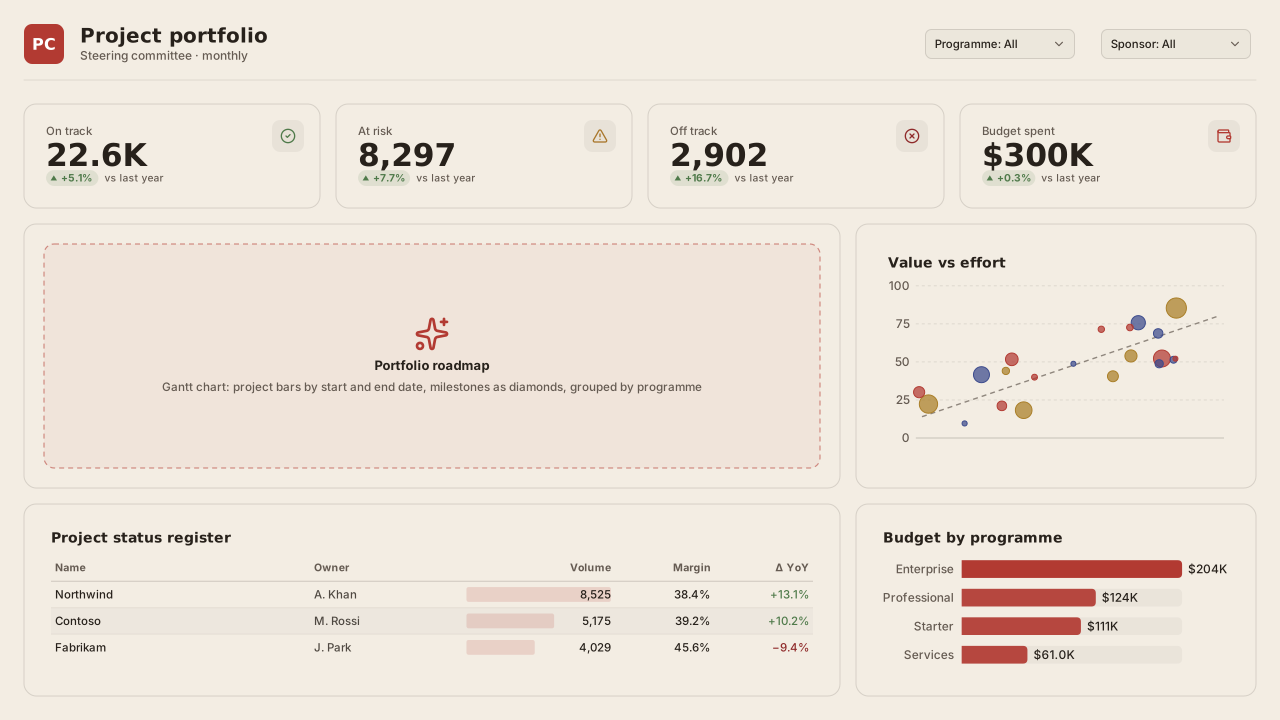 Project & PMO
Project Portfolio
Power BI project portfolio (PMO) dashboard template with RAG status KPIs, roadmap Gantt slot, value vs effort matrix, status register and budget by programme.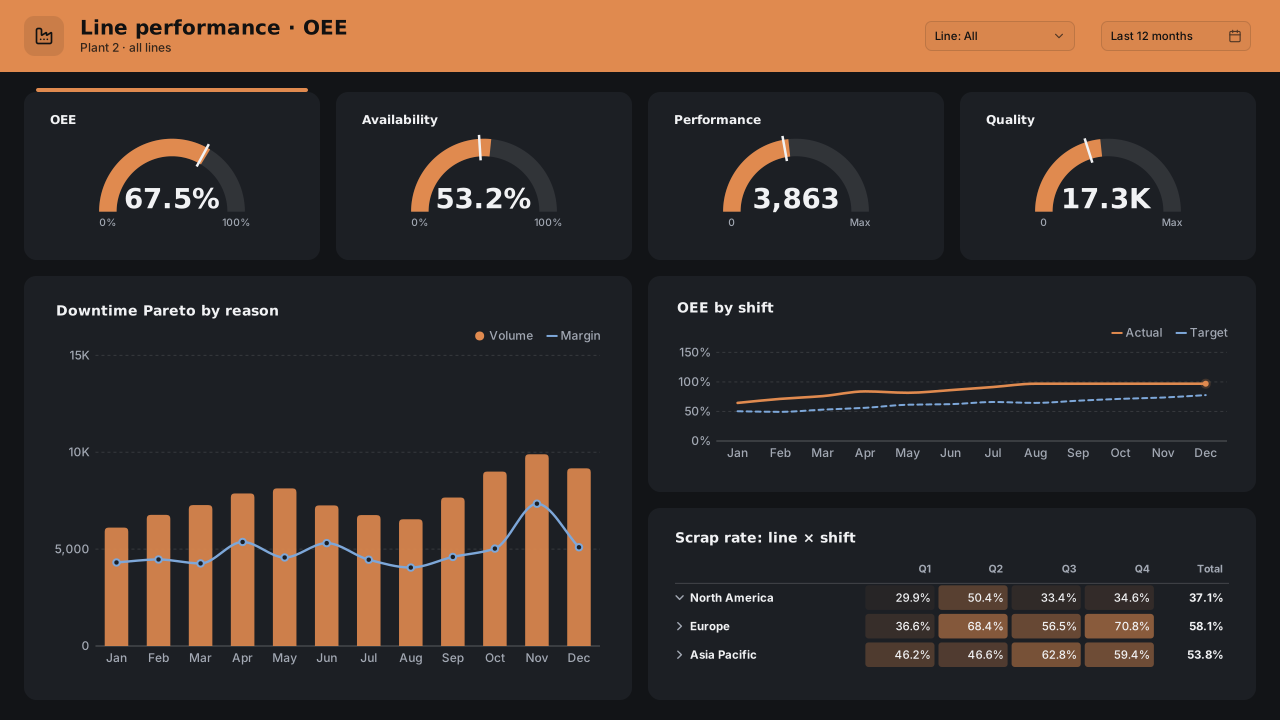 Manufacturing
 OEE
Power BI manufacturing OEE dashboard template: OEE, availability, performance and quality gauges, downtime Pareto, OEE by shift and scrap matrix.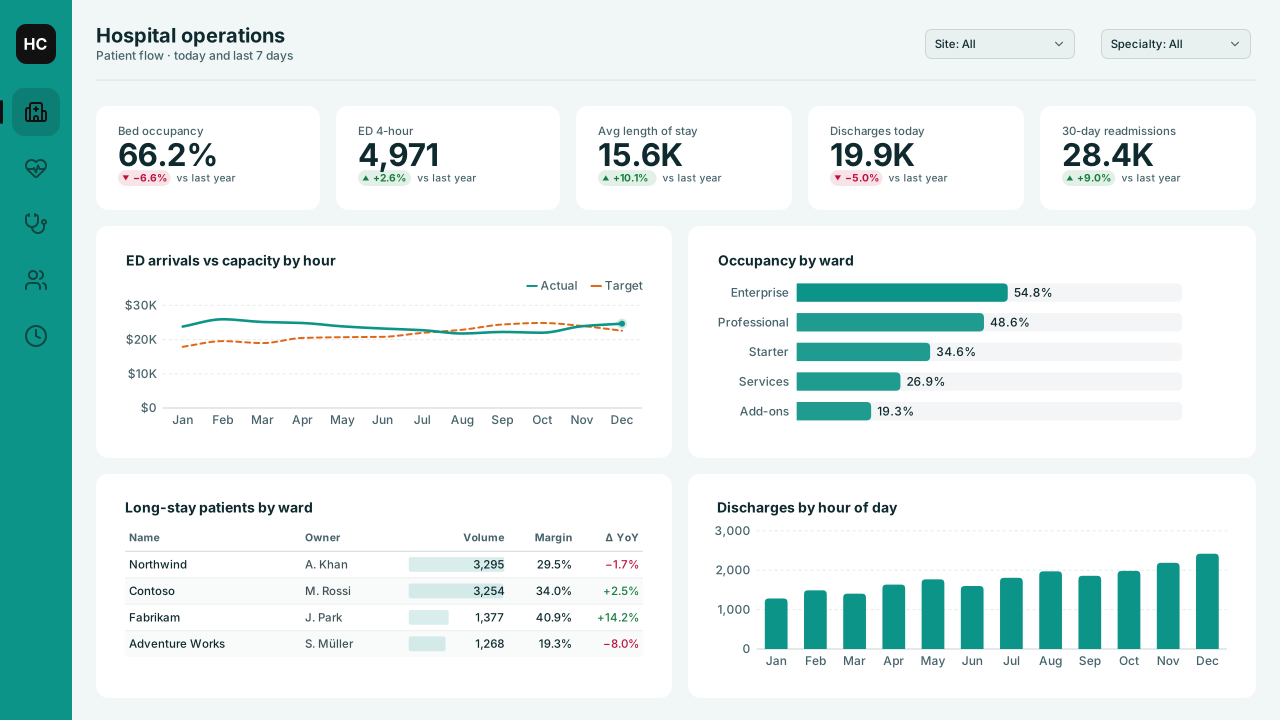 Healthcare
 Operations
Power BI hospital operations dashboard template: bed occupancy, ED 4-hour, length of stay and readmission KPIs, ED arrivals vs capacity and ward occupancy.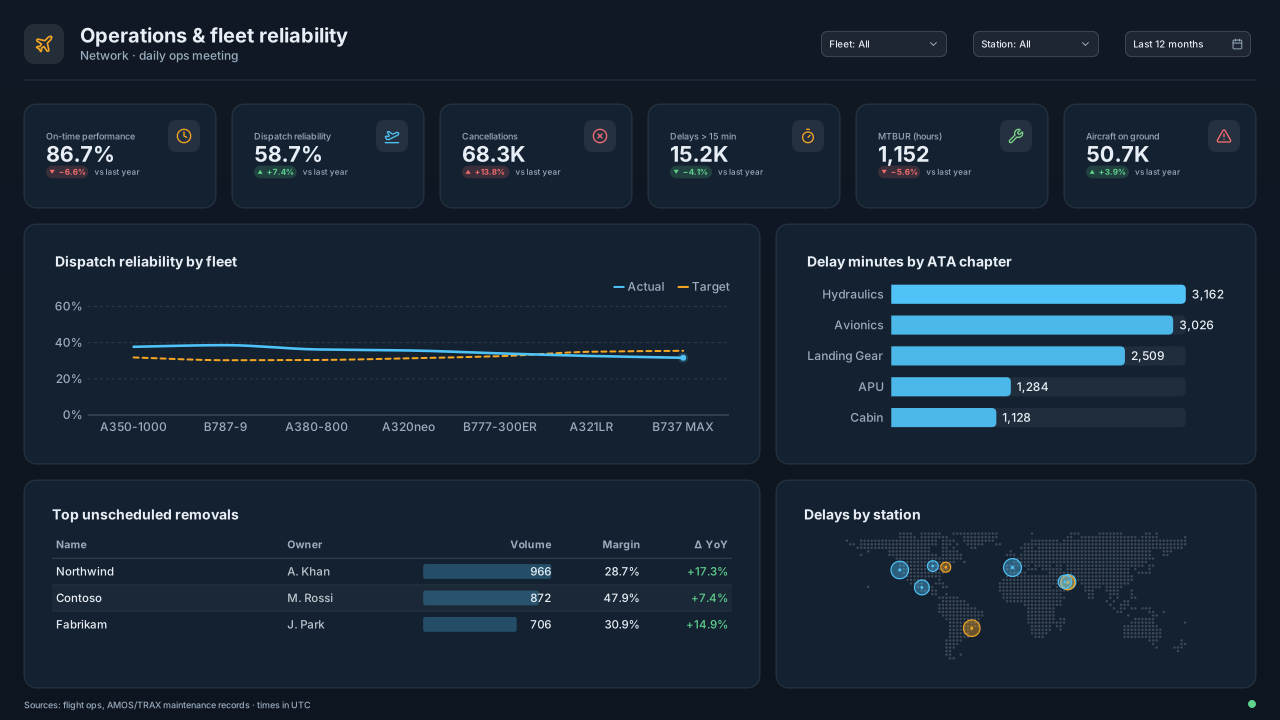 Aviation
Airline Operations & Fleet Reliability
Power BI airline operations template: OTP, dispatch reliability, cancellations, delays and AOG KPIs, fleet reliability trend, ATA delay causes and stations.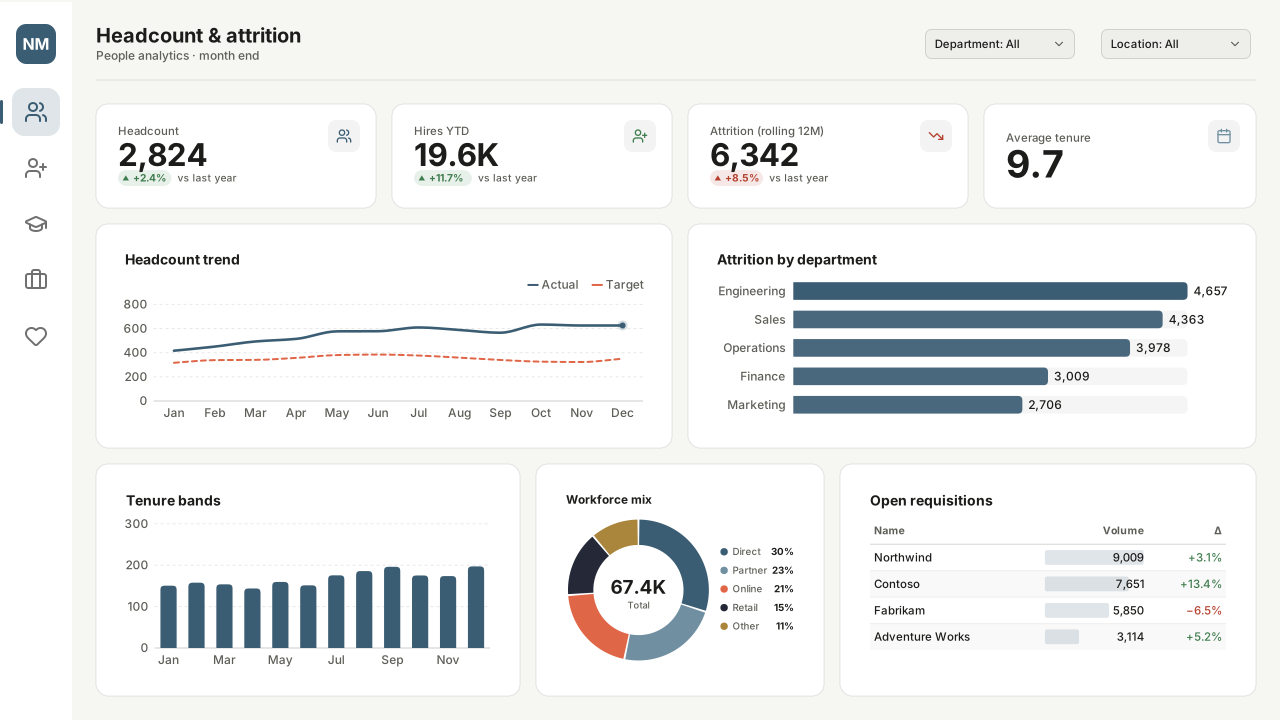 HR & people
HR Headcount & Attrition
Power BI HR dashboard template: headcount, hires, attrition and tenure KPIs, headcount trend, attrition by department, workforce mix and open requisitions.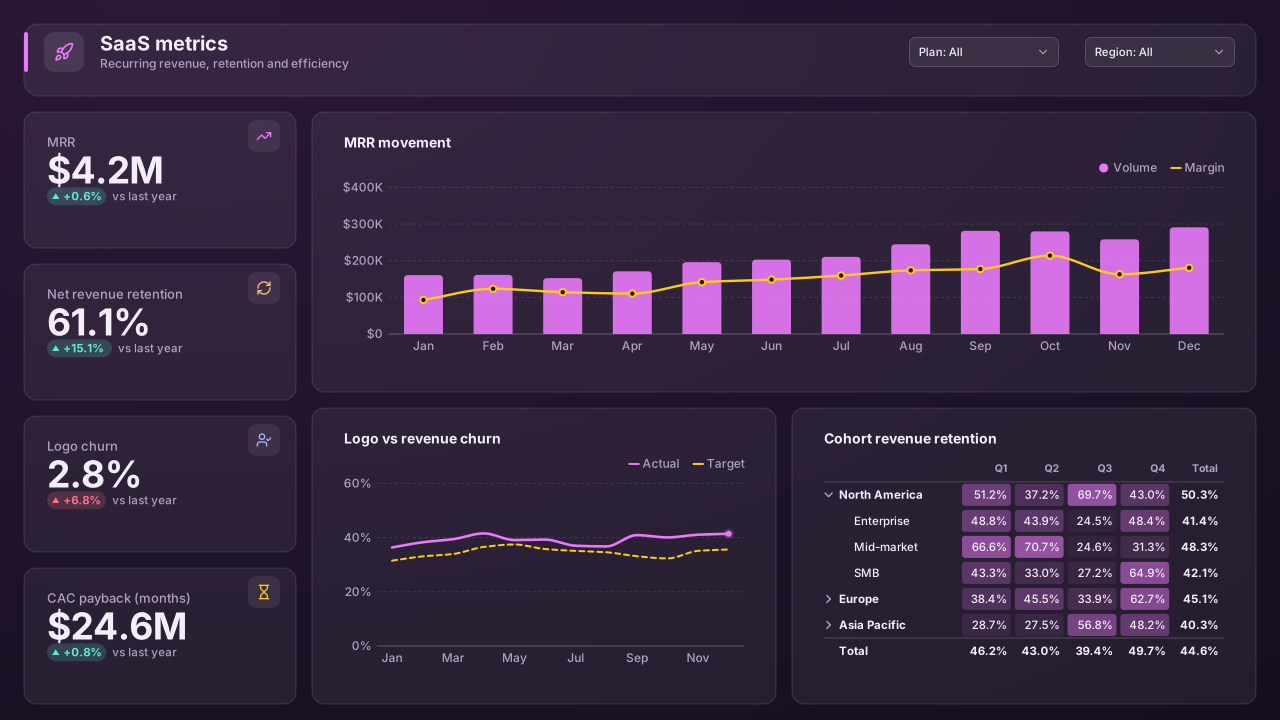 SaaS
SaaS Metrics: MRR & Churn
Power BI SaaS metrics dashboard template: MRR, net revenue retention, churn and CAC payback KPIs, MRR movement chart, churn trend and cohort retention matrix.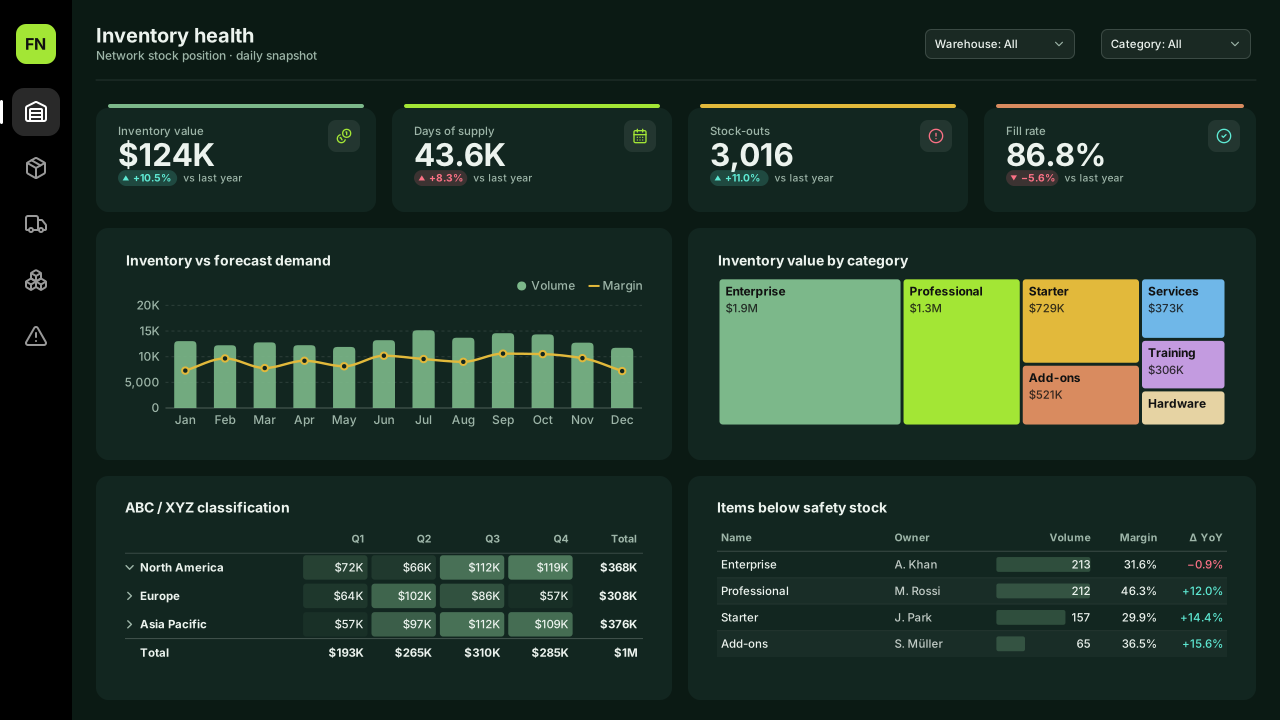 Supply chain
Supply Chain Inventory
Power BI inventory dashboard template: inventory value, days of supply, stock-outs and fill rate KPIs, inventory vs demand, a category treemap and stock alerts.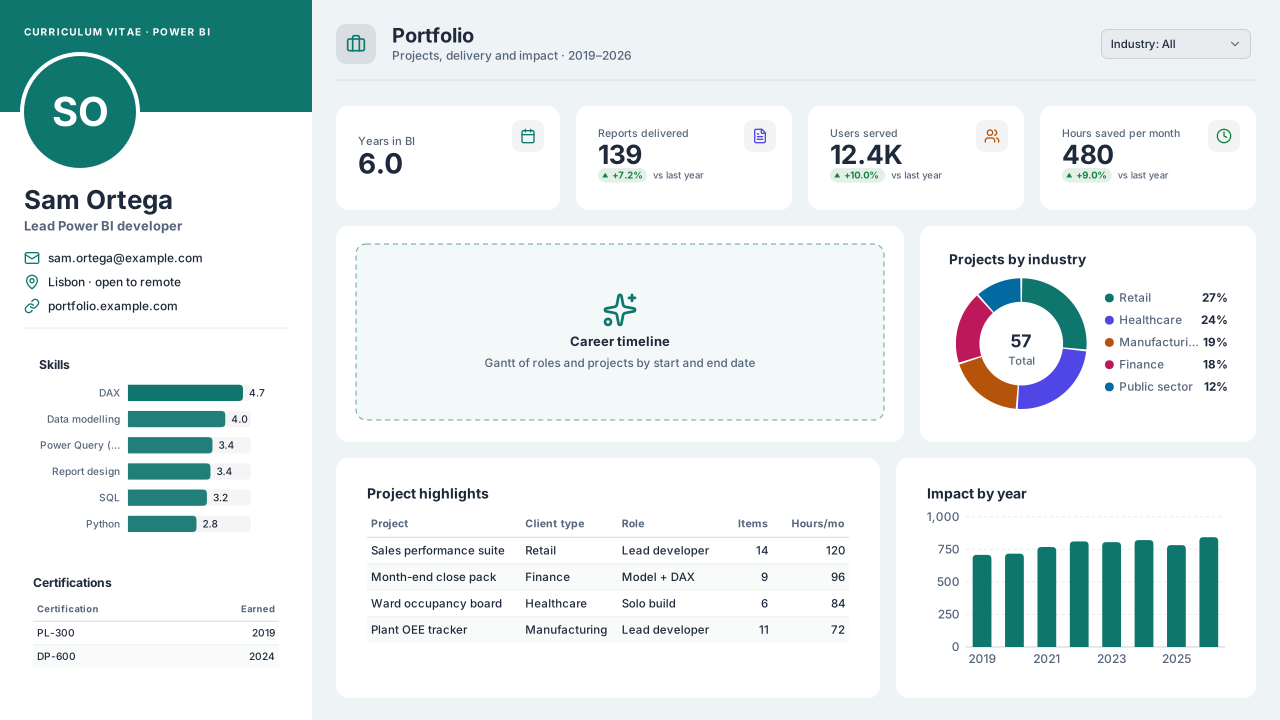 CV & portfolio
CV & Portfolio
Free Power BI CV template: a one-page résumé report with a profile sidebar, skills and certifications, impact KPIs, a career timeline slot and project highlights.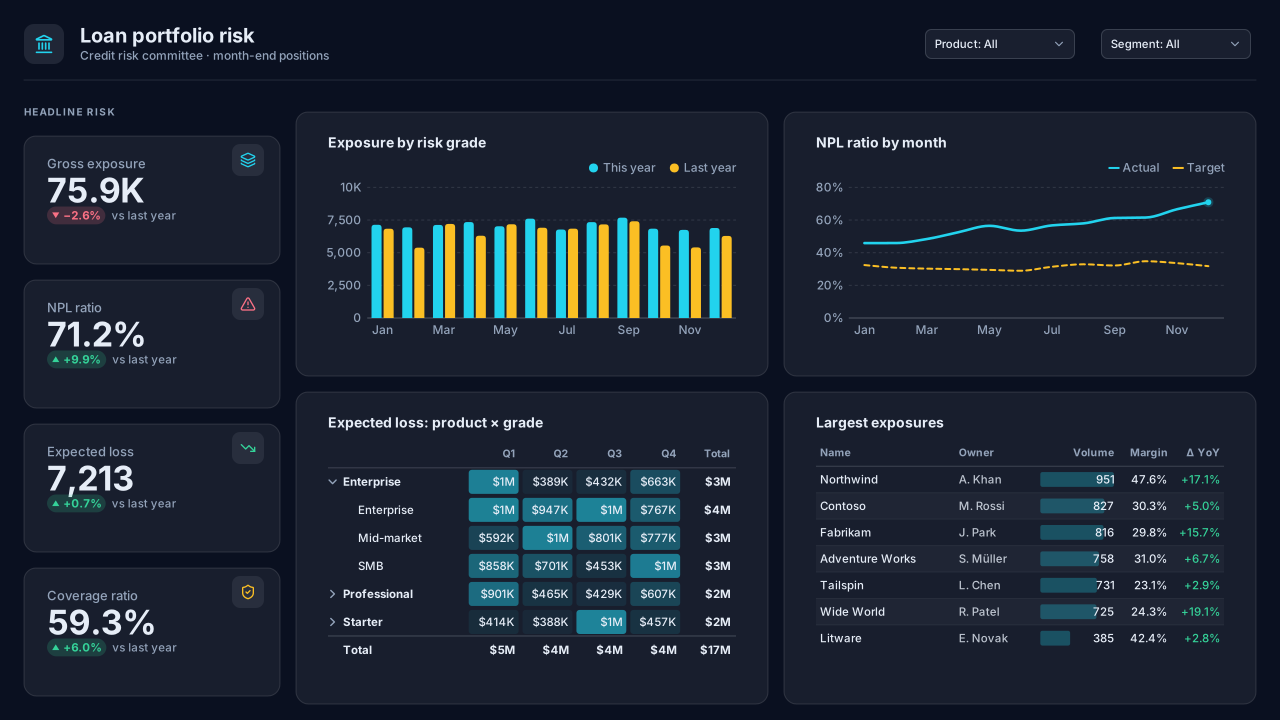 Banking
Loan Portfolio Risk
Dark Power BI bank credit risk dashboard template: gross exposure, NPL ratio, expected loss and coverage, exposure by risk grade and large exposures.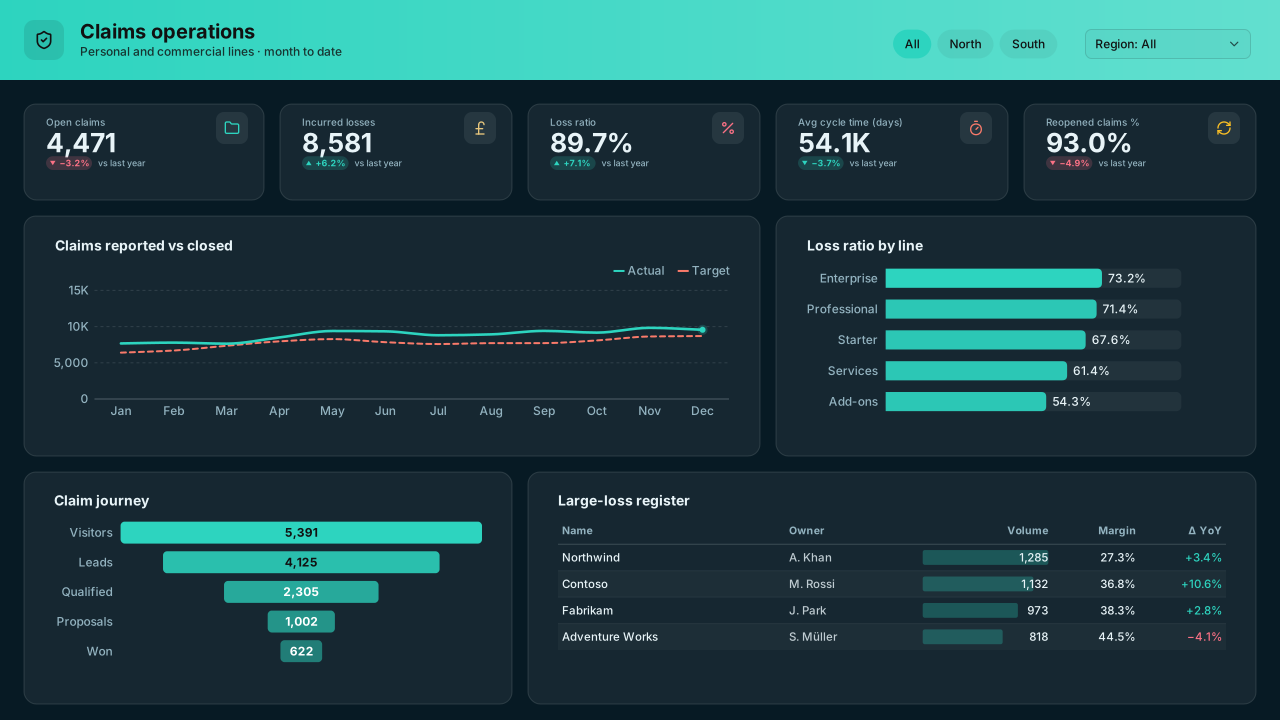 Insurance
 Claims
Dark Power BI insurance claims dashboard template: open claims, incurred losses, loss ratio and cycle time, a claim-journey funnel and large-loss register.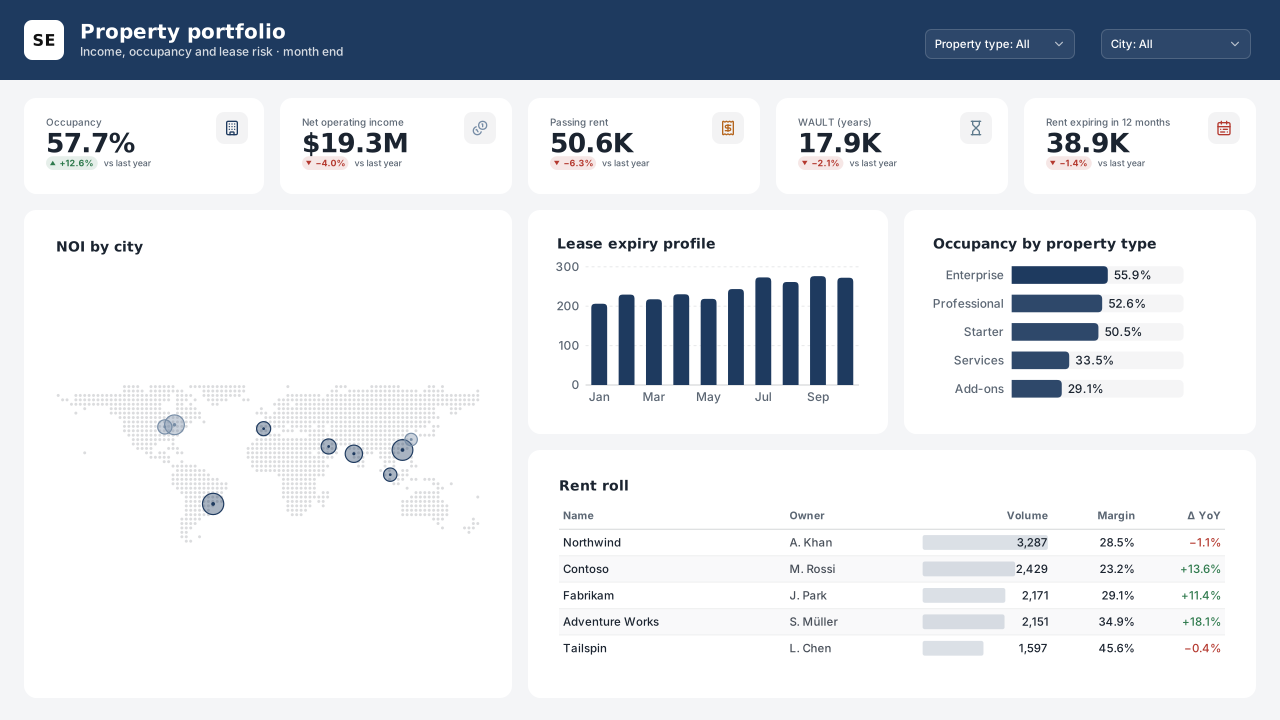 Real estate & workplace
Real Estate Property Portfolio
Power BI real estate portfolio dashboard template: occupancy, NOI, passing rent and WAULT, NOI map by city, lease expiry profile and a rent roll.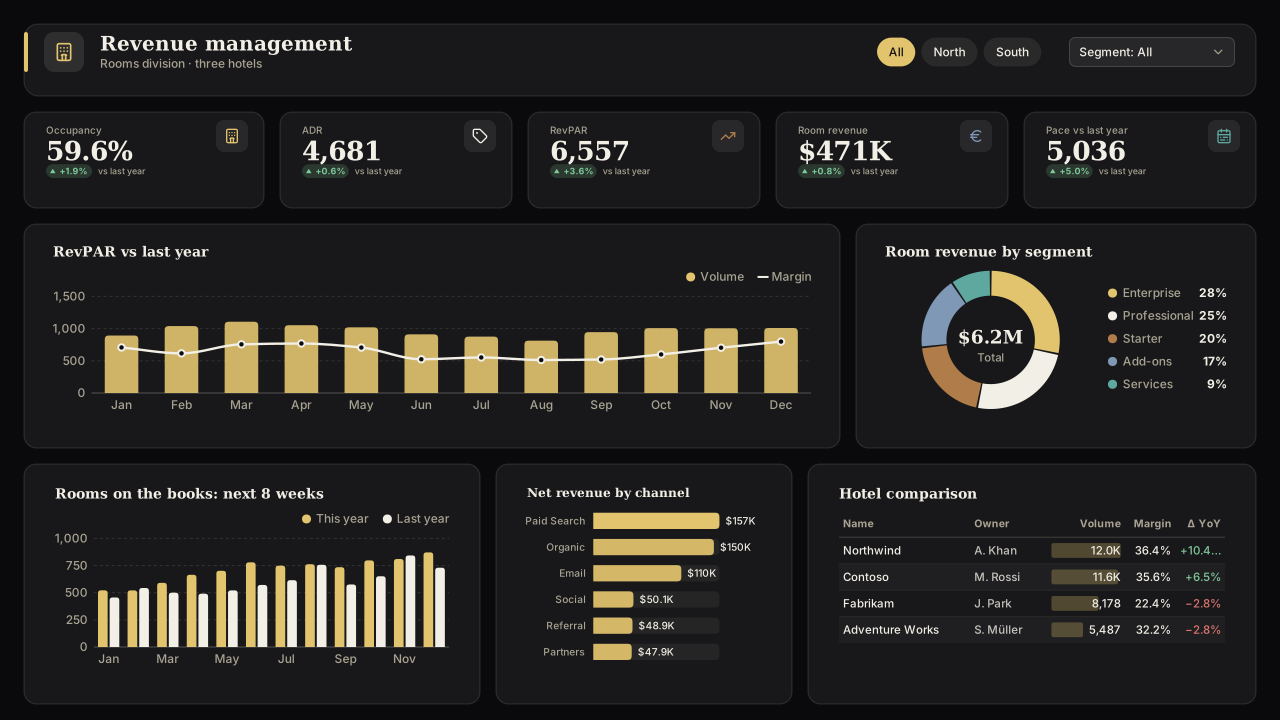 Hospitality
Hotel Revenue Management
Dark Power BI hotel dashboard template: occupancy, ADR and RevPAR vs last year, segment mix, booking pace for the next 8 weeks and net revenue by channel.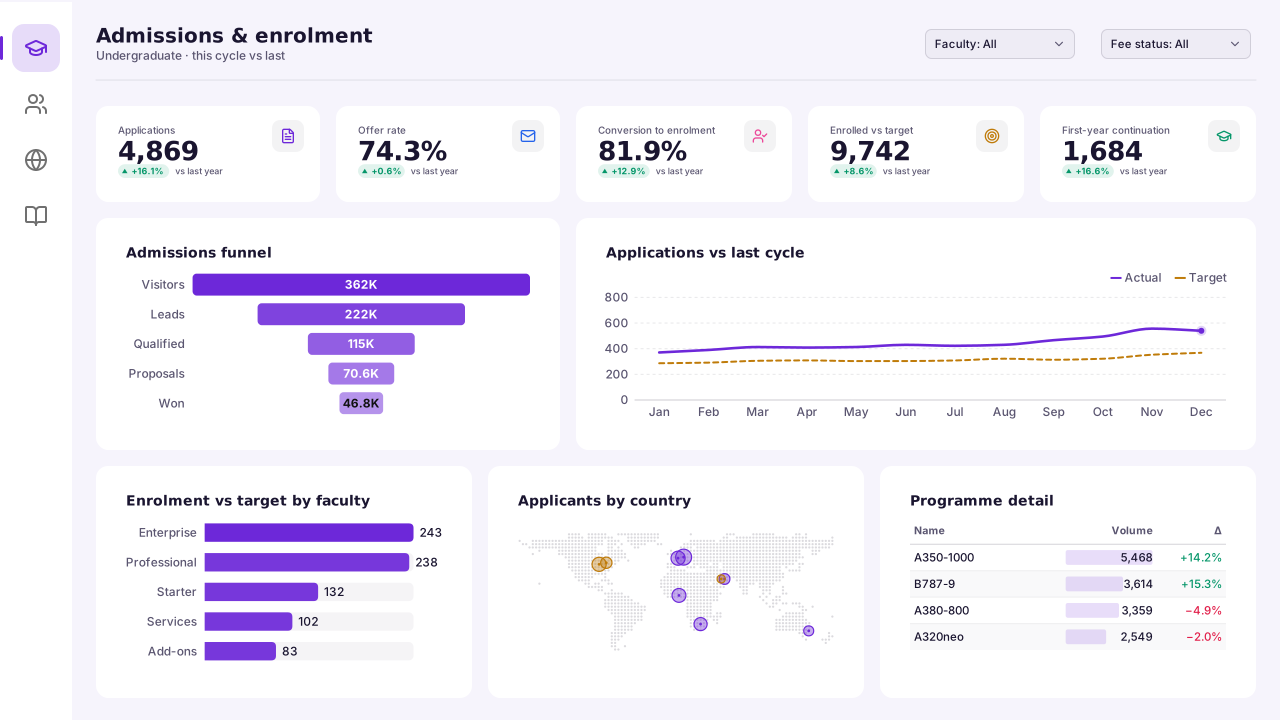 Education
University Admissions & Enrolment
Power BI university admissions dashboard template: applications vs last cycle, admissions funnel, enrolment vs target, applicant countries and continuation.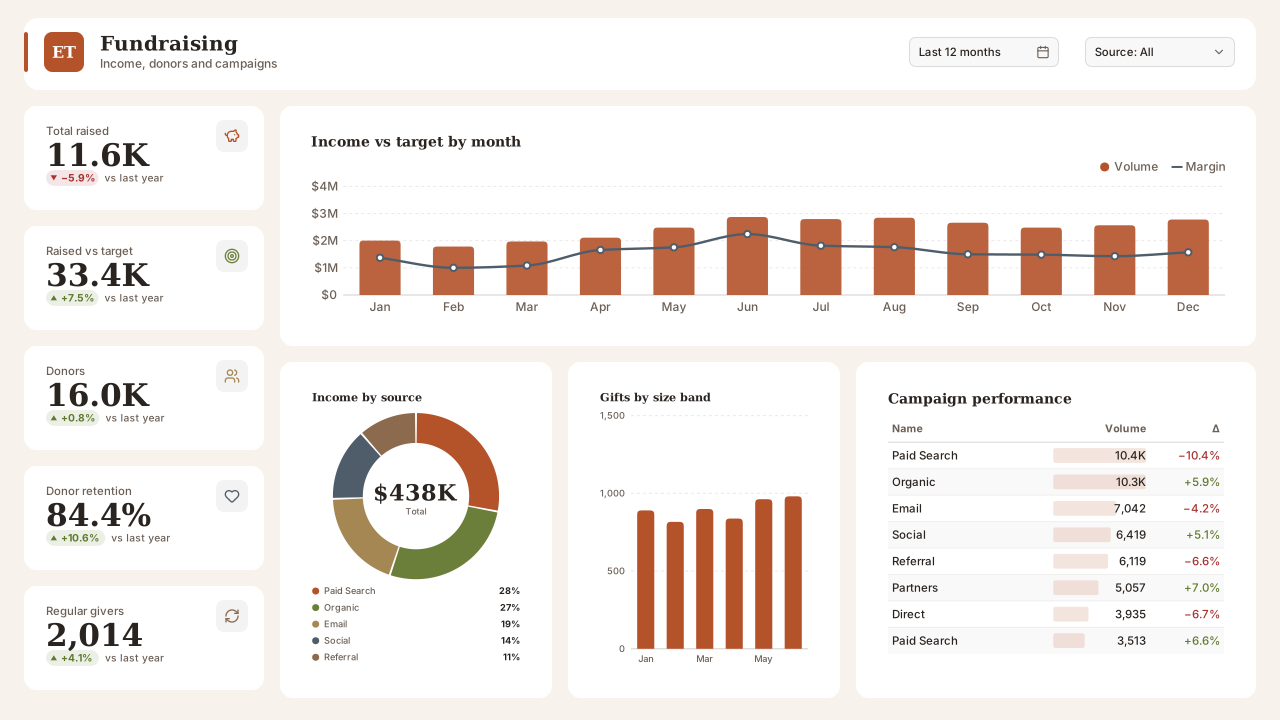 Nonprofit
 Fundraising
Power BI nonprofit fundraising dashboard template: income vs target, donor retention, regular givers, income by source, gift-size bands and campaign ROI.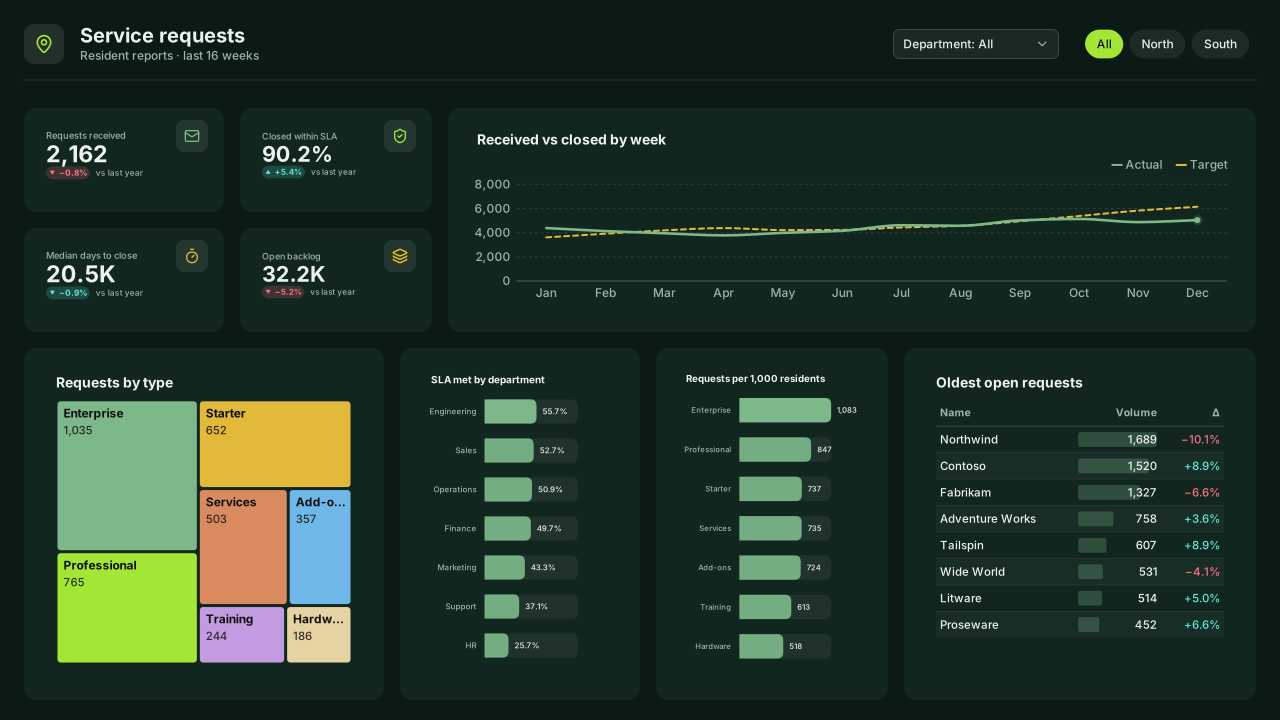 Public sector
City Service Requests (311)
Dark Power BI 311 / council service request dashboard template: received vs closed, SLA by department, requests per 1,000 residents, oldest open cases.
What the 2026 layouts have in common
Counted from the catalog's own layout files at build time, so the numbers change when the catalog does.
KPI cards per page
Median: 5 cards.
- No KPI cards1 (2%)
- 1–3 KPIs4 (7%)
- 4–5 KPIs51 (84%)
- 6+ KPIs5 (8%)
Visuals the layouts use
- Table50 layouts
- Bar chart43 layouts
- Column chart31 layouts
- Line chart28 layouts
- Donut chart18 layouts
- Line & column chart15 layouts
- Matrix15 layouts
- Area chart8 layouts
Light, dark and data
- Light layouts35
- Dark layouts26
- With a sample-data PBIP61 of 61
- Themes (colour-blind-safe)80 (2)
These are counts of VizForge's own catalog, not a survey of Power BI reports in general. They describe the layouts you can download here.
Techniques worth knowing in 2026
Built-in Power BI features, one recipe each, with menu paths and DAX.
- Custom Conditional Formatting Icons in Power BIPower BI's Icons conditional formatting has built-in sets (arrows, shapes, flags, ratings).
- Dynamic Titles in Power BI with a DAX MeasureWrite a measure that returns the title as text, then in the visual's Format pane open General → Title, click fx next to Text, set Format style to Field value and pick the measure.
- Power BI Field Parameters: Switch Measures and AxesField parameters let a slicer choose which measure or column a visual uses.
- Calculation Groups in Power BI Desktop (Time Intelligence)A calculation group applies the same logic to any measure.
- Toggle Between a Chart and a Table with BookmarksPlace the chart and the table in the same spot.
- Drillthrough to a Detail Page in Power BICreate a detail page and drag the field to drill on (for example Customer) into the Drill through well of its Build pane.
- Report Page Tooltips in Power BIMake a small page, turn on Allow use as tooltip in Format page → Page information, and set Canvas settings → Type to Tooltip.
- Small Multiples in Power BI (Native)Small multiples split one chart into a grid of mini charts, one per value of a field.
- Sparklines in Power BI Tables and MatricesSelect a table or matrix, open the menu of a measure in the Values well and choose Add a sparkline.
- Top N with 'Others' in Power BI (DAX Pattern)The built-in Top N filter drops everything outside the top N.
- Sort Month Names Correctly in Power BI (Sort by Column)Month names sort alphabetically (April, August…) because they are text.
- Colour Bars and Cells by a Measure in Power BIWrite a measure that returns a hex colour per data point, then use it as the colour source: on a bar or column chart, Format → Columns (or Bars) → Colors → fx; on a table or matrix, a field's Conditional formatting → Background color or Font color.
The asset library at the end of 2026
- 61dashboard templates
- 80contrast-checked themes
- 14page backgrounds
- 3,034open-licence icons
- 28KPI card designs
- 12native technique recipes
Keep exploring
61 hand-designed Power BI page layouts by department.
80 contrast-checked theme JSON files, light and dark.
3,034 icons in 40 categories as SVG, PNG, DAX or theme icon JSON.
Design a report page and export it to Power BI.
Start your own example
Open the Design Studio, pick a layout and brand it, then export the background, theme JSON and a PBIP project for Power BI Desktop.
The design studio for Power BI. Free, in your browser, no sign-up.