6 free templates · Finance
Finance dashboard templates for Power BI
Finance templates
Each template downloads as a background image, a theme JSON and a PBIP project; the ones marked with sample data open in Power BI Desktop with bound visuals.
 With sample data
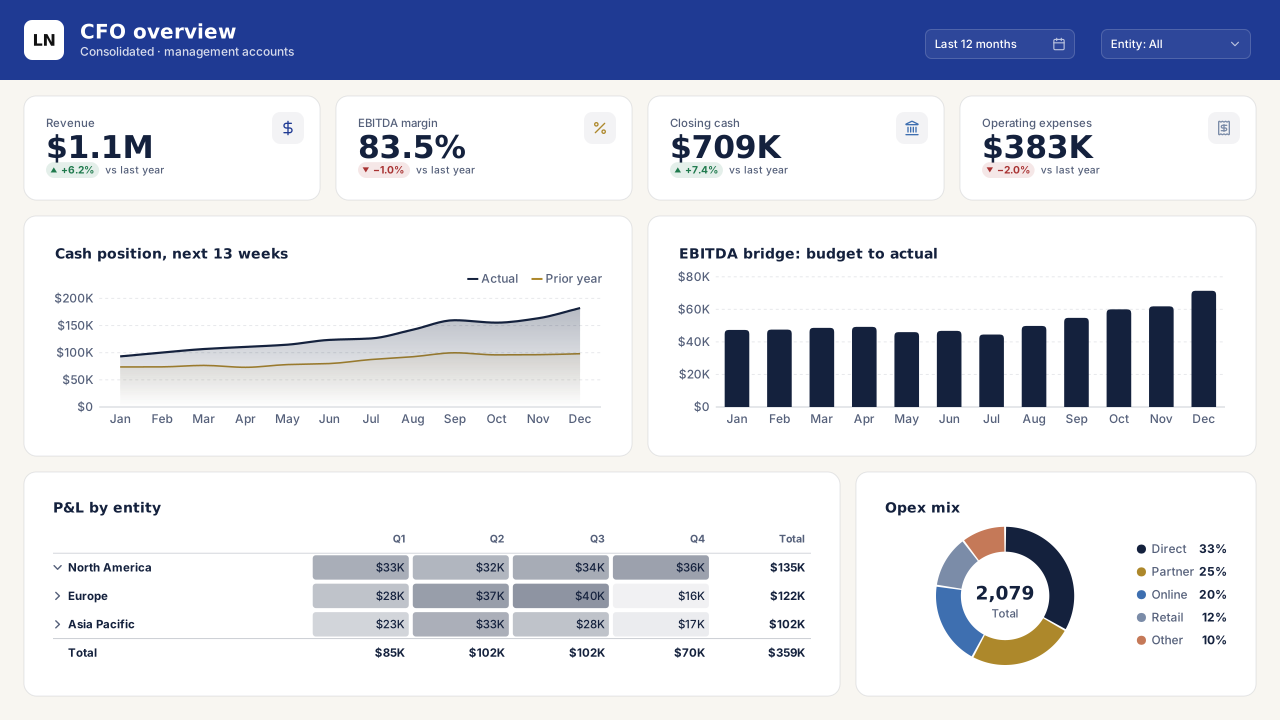
CFO Overview
Power BI CFO dashboard template with revenue, EBITDA, cash and opex KPIs, a 13-week cash view, EBITDA bridge, P&L matrix and opex mix.Free for commercial use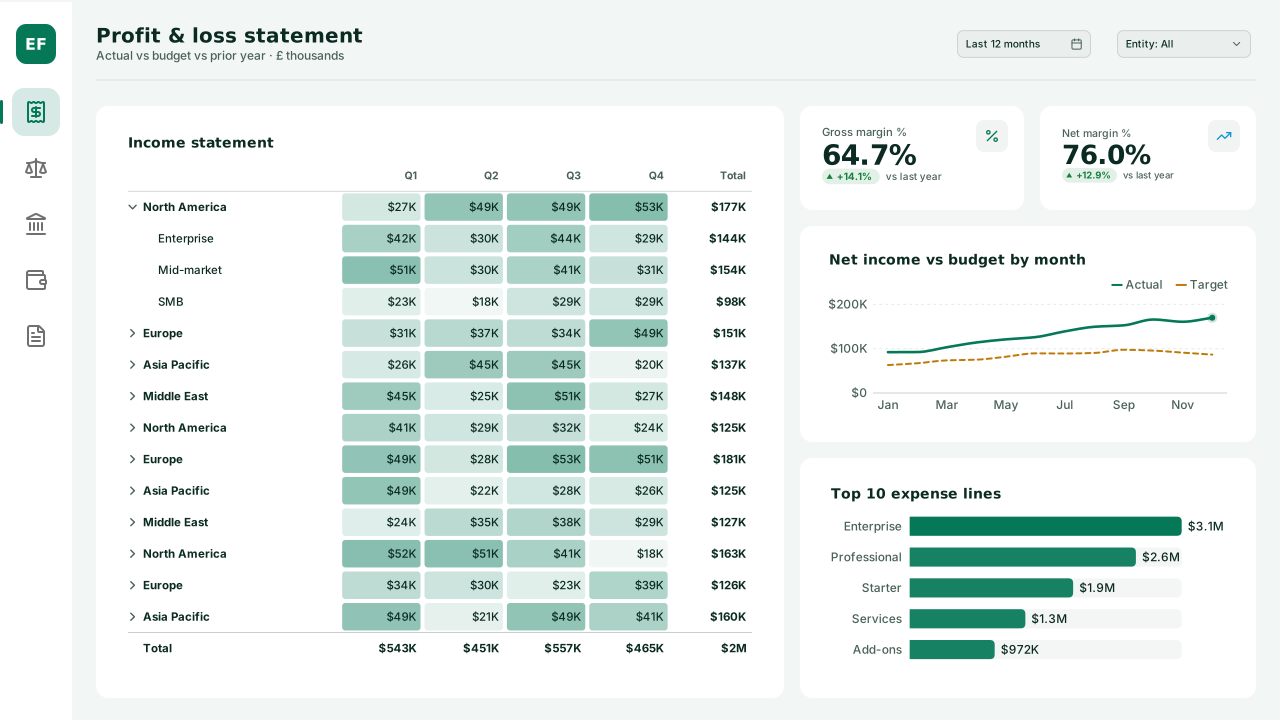 With sample data
Profit & Loss Statement
Power BI P&L statement template: a full-height income statement matrix with actual, budget and prior year, margin KPIs and expense drivers.Free for commercial use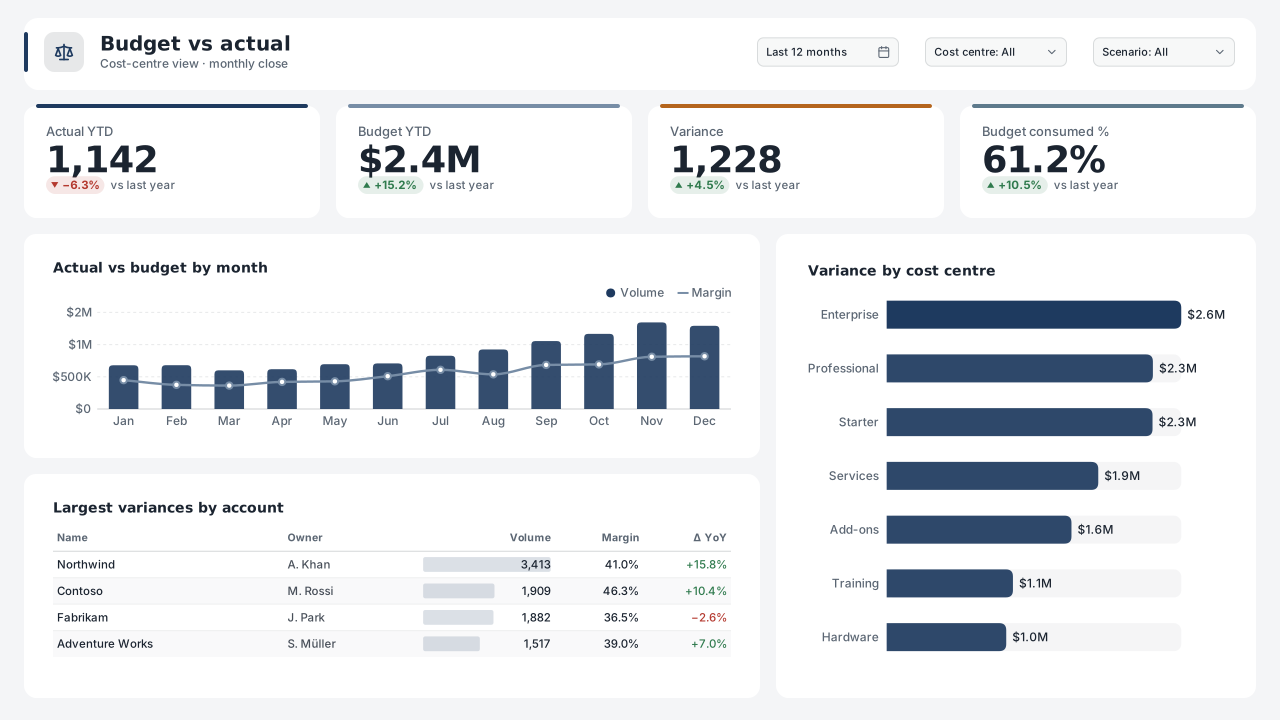 With sample data
Budget vs Actual
Budget vs actual Power BI template for cost-centre owners: actual, budget, variance and burn-rate KPIs, monthly combo chart and variance ranking.Free for commercial use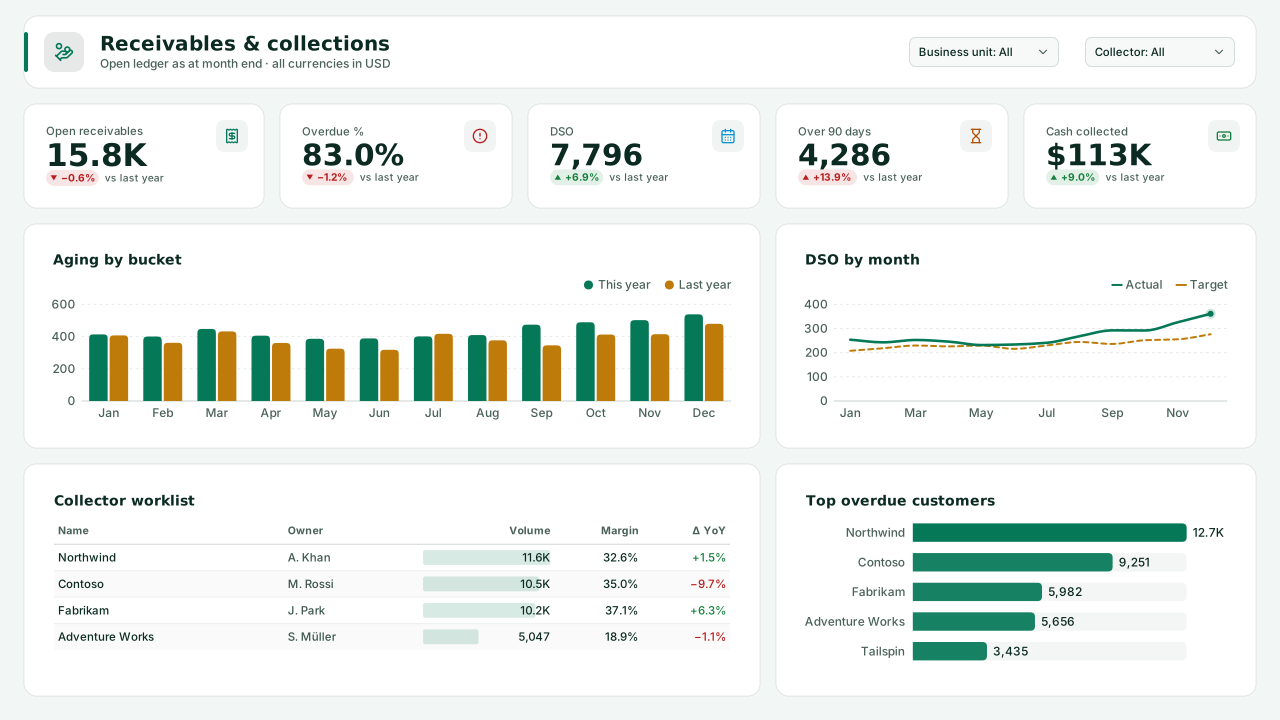 With sample data
Accounts Receivable & Collections
Power BI accounts receivable dashboard template: open and overdue AR, DSO trend, aging buckets by segment, a collector worklist and top overdue customers.Free for commercial use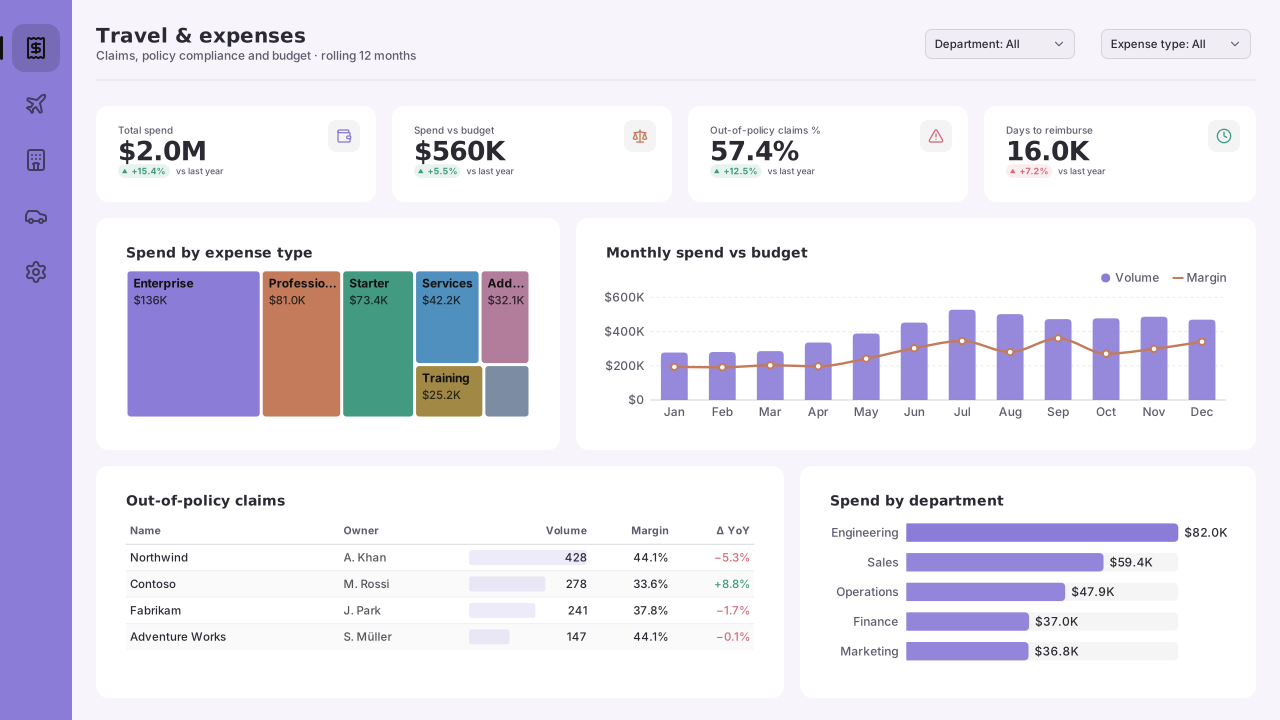 With sample data
Travel & Expense Management
Power BI travel and expense (T&E) template: spend vs budget by month, spend by expense type, out-of-policy claims and days to reimburse.Free for commercial use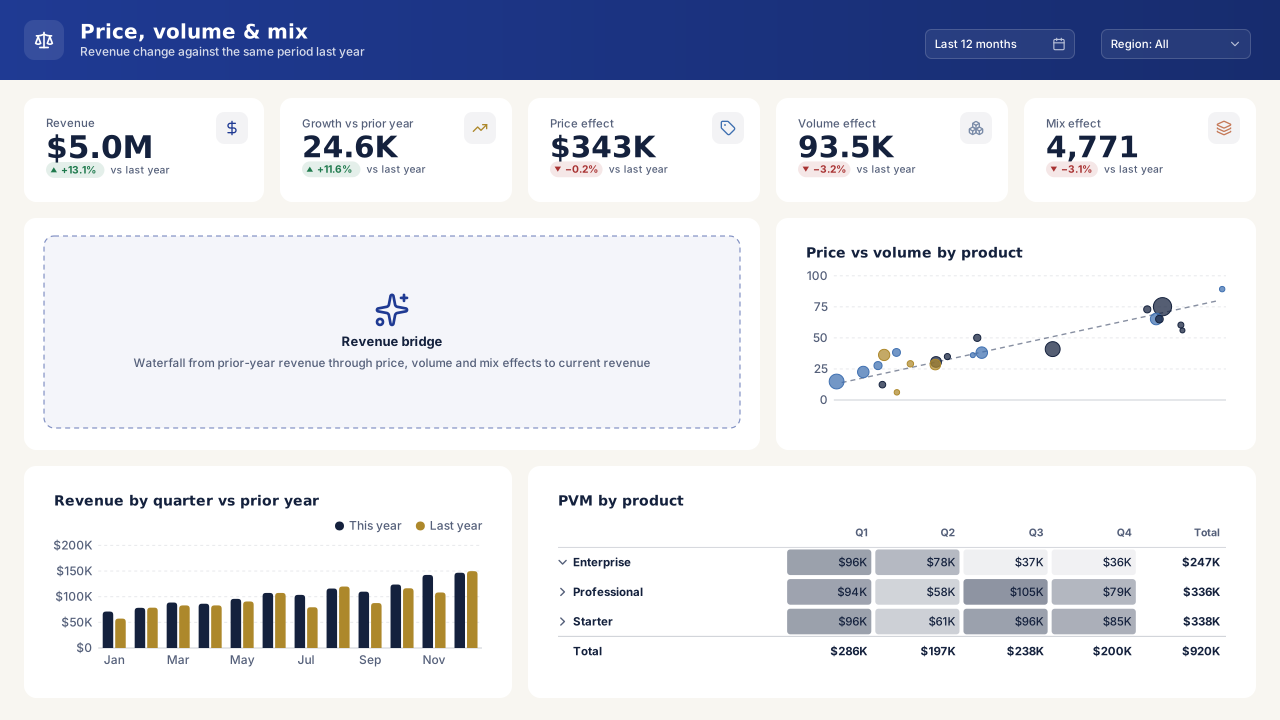 With sample data
Price-Volume-Mix Analysis
Power BI price-volume-mix (PVM) template: revenue growth split into price, volume and mix effects in DAX, a bridge slot, product scatter and PVM matrix.Free for commercial use
What a finance dashboard should answer
- How do actuals compare with budget and last year, line by line?
- Which cost lines explain the margin variance?
- What is the cash position and how many days of cover does it give?
- Where will the year land on the current forecast?
Layout advice
Finance readers expect numbers right-aligned in a matrix with consistent units (thousands or millions, never mixed) and variances in their own columns with sign colouring. Give the statement the widest panel and keep charts to the variance bridge and one trend.
Check any layout with the Design Check in the Design Studio (contrast, grid, gutters), and pick a contrast-checked theme to match.
Beyond the template
Custom visuals and dashboard recipes for the same team.
Team hub
Power BI visuals for FinanceVariance bridges, balance-sheet smalls, scenario sliders — the finance visuals Power BI's native waterfall and cards don't cover.
Dashboard recipe
Best Power BI Visuals for Financial ReportingThe best Power BI visuals for financial reporting — waterfall bridges, variance matrices, SPC control, bullet…
Dashboard recipe
Best Power BI Visuals for an Executive ScorecardThe best Power BI visuals for an executive scorecard — KPI cards, bullet grids, sparkline rows, SPC quality…
Templates for other departments
- Executive 1
- Sales 3
- Marketing 4
- Retail & e-commerce 3
- SaaS 2
- Operations 4
- HR & people 5
- Supply chain 7
- Manufacturing 3
- Healthcare 3
- IT 3
- Project & PMO 2
- Aviation 1
- Banking 3
- Insurance 2
- Real estate & workplace 2
- Hospitality 2
- Education 2
- Nonprofit 1
- Public sector 1
- CV & portfolio 1
Keep exploring
61 hand-designed Power BI page layouts by department.
80 contrast-checked theme JSON files, light and dark.
Page backgrounds at 1280×720 and 1920×1080 with visual positions.
3,034 icons in 40 categories as SVG, PNG, DAX or theme icon JSON.
Make a finance page your own
Open a template in the Design Studio to change colours, fonts, logo and layout, then export the background, theme JSON and PBIP project.
The design studio for Power BI. Free, in your browser, no sign-up.