SaaS · Power BI template
Product Analytics & Feature Adoption Power BI template
Dark Power BI product analytics template: DAU, stickiness (DAU/MAU), activation funnel, feature adoption by plan and a week-by-week retention cohort table.
By Nawaf Sharaf · Founder & Reliability Engineer · Updated
Free for commercial useLight version: same layout, colours re-solved and checked for WCAG AA contrast.
BetaOpens in Power BI Desktop with 9 tables of sample data and every visual bound. See what’s inside
Free, no sign-up. The PBIP with sample data includes the background, theme and a README. 1920×1080 fits a new page in a Fluent 2 report; 1280×720 and 2× fit Classic pages. Downloads carry a small “Made with VizForge” mark (sign in to the studio to remove it).
- Layout
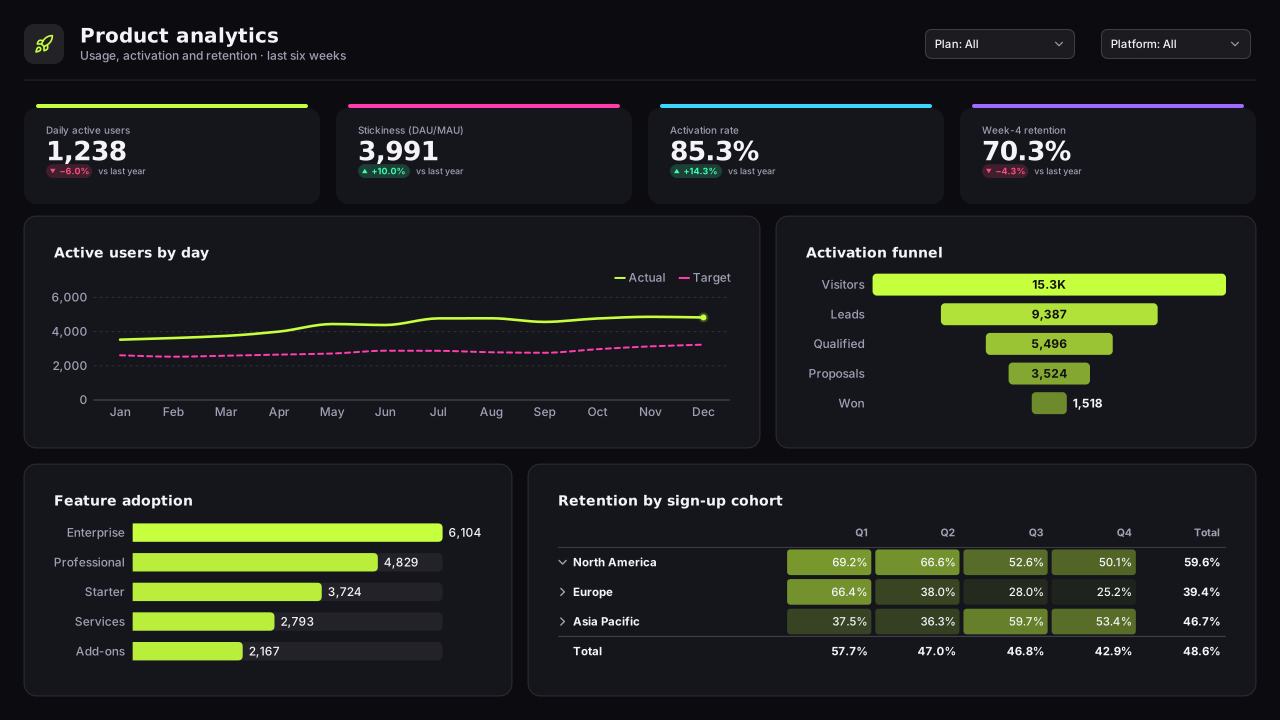
- Plain header, 4 bold KPIs, daily active users + activation funnel, feature-adoption bars + retention cohort matrix
- Page size
- 1280×720 px (16:9, Power BI default)
- Theme
- Carbon Neon
Open the sample-data PBIP in Power BI Desktop
Checked against Microsoft Learn's Power BI Desktop projects documentation (as of Nov 2026).
- 1
Unzip to a short path and open the .pbip
Extract the zip to a short local folder such as C:\PBI (Windows limits project paths to 260 characters, and Desktop can't save a project straight to OneDrive or SharePoint), then double-click the .pbip file or use File → Open in Power BI Desktop. Microsoft still lists projects and TMDL as preview features (as of Nov 2026): if Desktop won't open the project, go to File → Options and settings → Options → Preview features, tick “Power BI Project (.pbip) save option” and “Store semantic model using TMDL format”, then restart Desktop.
- 2
Select Refresh once
The project ships without the local data cache (.pbi/cache.abf), so Desktop opens the full model definition without data. Select Home → Refresh: every table is built from values written into its Power Query step, so there is no data source to sign in to.
- 3
Save as .pbix or connect your data
Use File → Save as to keep a single .pbix file, or open Transform data and replace each table's Source step with your own query, keeping the column names so the measures and visuals keep working.
What’s inside the Product Analytics sample model
Rendered from the same definition the download writes as TMDL, so this list always matches the file.
Six weeks of product usage for a fictional work-management app (to 31 Oct 2026): daily active users and trailing-28-day active users by plan and platform, monthly feature adoption among active accounts, an activation funnel for weekly sign-up cohorts, and week-by-week retention for six cohorts. Units: Users and accounts.
Tables and columns
Calendar
Date table · 2026, one row per dayDate table generated in Power Query (List.Dates), marked as the model's date table.
- Date (date)
- Year (whole number)
- Quarter (text)
- Month (text)
- Month Name (text)
- Week Start (date)
- Weekday (text)
- Fiscal Year (text)
Plan
Dimension · 3 rowsSubscription plans.
- Plan (text)
Platform
Dimension · 3 rowsWhere the product is used.
- Platform (text)
Feature
Dimension · 8 rowsProduct features tracked.
- Feature (text)
Activation Step
Dimension · 4 rowsOnboarding milestones in order.
- Step (text)
- Step Order (hidden, used by DAX) (whole number)
Daily Usage
Fact · 378 rowsDaily active users and trailing-28-day active users per plan and platform.
- Date (date)
- Plan (text)
- Platform (text)
- DAU (whole number)
- MAU (whole number)
Feature Usage
Fact · 48 rowsAccounts using each feature among active accounts, per month and plan.
- Month (date)
- Feature (text)
- Plan (text)
- Accounts Using (whole number)
- Active Accounts (whole number)
Activation
Fact · 72 rowsAccounts from each weekly sign-up cohort reaching each onboarding step.
- Cohort Week (date)
- Plan (text)
- Step (text)
- Accounts (whole number)
Retention
Fact · 21 rowsActive accounts in each week after sign-up, per cohort.
- Cohort Week (date)
- Week Number (whole number)
- Cohort Size (whole number)
- Active Accounts (whole number)
Relationships
Many-to-one, single direction. Inactive relationships are switched on inside a measure with USERELATIONSHIP.
- 'Daily Usage'[Date] → 'Calendar'[Date]
- 'Daily Usage'[Plan] → Plan[Plan]
- 'Daily Usage'[Platform] → Platform[Platform]
- 'Feature Usage'[Month] → 'Calendar'[Date]
- 'Feature Usage'[Feature] → Feature[Feature]
- 'Feature Usage'[Plan] → Plan[Plan]
- Activation[Cohort Week] → 'Calendar'[Date]
- Activation[Plan] → Plan[Plan]
- Activation[Step] → 'Activation Step'[Step]
- Retention[Cohort Week] → 'Calendar'[Date]
DAX measures
All measures live in a dedicated Key Measures table. Copy any of them into your own model; rename the table and column references to match.
DAUAverage daily active users.
DAU =
AVERAGEX ( VALUES ( 'Calendar'[Date] ), CALCULATE ( SUM ( 'Daily Usage'[DAU] ) ) )
Format string: #,0
MAUAverage trailing-28-day active users.
MAU =
AVERAGEX ( VALUES ( 'Calendar'[Date] ), CALCULATE ( SUM ( 'Daily Usage'[MAU] ) ) )
Format string: #,0
Stickiness (DAU/MAU)Share of monthly users active on a given day.
Stickiness (DAU/MAU) =
DIVIDE ( [DAU], [MAU] )
Format string: 0%
Feature Adoption %Active accounts using the feature.
Feature Adoption % =
DIVIDE ( SUM ( 'Feature Usage'[Accounts Using] ), SUM ( 'Feature Usage'[Active Accounts] ) )
Format string: 0%
Accounts Reaching StepAccounts that reached the onboarding step.
Accounts Reaching Step =
SUM ( Activation[Accounts] )
Format string: #,0
Activation RateSign-ups who reached the last onboarding step.
Activation Rate =
DIVIDE (
    CALCULATE ( [Accounts Reaching Step], 'Activation Step'[Step Order] = 4 ),
    CALCULATE ( [Accounts Reaching Step], 'Activation Step'[Step Order] = 1 )
)
Format string: 0%
Retention %Cohort accounts active in that week.
Retention % =
DIVIDE ( SUM ( Retention[Active Accounts] ), SUM ( Retention[Cohort Size] ) )
Format string: 0%
Week-4 RetentionAccounts still active four weeks after sign-up.
Week-4 Retention =
CALCULATE ( [Retention %], Retention[Week Number] = 4 )
Format string: 0%
What each visual is bound to
The PBIP opens with these fields already on each visual.
| Visual | Type | Fields |
|---|---|---|
| PlanSlicer | Slicer | Plan[Plan] |
| PlatformSlicer | Slicer | Platform[Platform] |
| Daily active usersCard | Card | [DAU] |
| Stickiness (DAU/MAU)Card | Card | [Stickiness (DAU/MAU)] |
| Activation rateCard | Card | [Activation Rate] |
| Week-4 retentionCard | Card | [Week-4 Retention] |
| Active users by dayLine chart | Line chart | Calendar[Date], [DAU], [MAU] |
| Activation funnelFunnel | Funnel | 'Activation Step'[Step], [Accounts Reaching Step] |
| Feature adoptionBar chart | Bar chart | Feature[Feature], [Feature Adoption %] |
| Retention by sign-up cohortMatrix | Matrix | Retention[Cohort Week], [Retention %], Retention[Week Number] |
Questions this dashboard answers
Each one is answered by a visual on the page, from the sample model's own tables and measures.
- How sticky is the product (daily over monthly active users)?
- Which features do active accounts actually use, by plan?
- Where do new sign-ups drop out before they reach the first moment of value?
- How many of each week's sign-ups are still active four weeks later?
About this dashboard layout
Product teams need to know whether people find value fast and keep coming back. The cards cover both ends: daily active users, stickiness (average daily over average 28-day active users), activation rate (sign-ups who reach the last onboarding step) and week-4 retention.
Active users by day plots DAU against the trailing 28-day count. Weekends dip in a work product, which is why stickiness is averaged over the days in context rather than read off one day. The activation funnel follows sign-ups through creating a board, inviting a teammate and using a template or automation; the invite step is usually where most accounts stop.
Feature adoption ranks features by the share of active accounts using them each month, and the Plan slicer shows whether paid plans use the features they pay for. The retention matrix has sign-up cohorts as rows and weeks since sign-up as columns; with a colour scale it becomes the classic cohort triangle, where better onboarding shows up as darker cells in the later rows.
The sample is six weeks of usage for a fictional work-management app with three plans and three platforms; AI summaries adoption jumps in October after a launch.
Visuals on the page
Positions are Power BI page pixels. Enter them in Format → General → Properties → Size and position, or use the PBIP download where they are already set.
| Visual | Type | X | Y | Width | Height |
|---|---|---|---|---|---|
| Plan | Slicer | 920 | 24 | 160 | 40 |
| Platform | Slicer | 1096 | 24 | 160 | 40 |
| Daily active users | Card | 40 | 120 | 264 | 64 |
| Stickiness (DAU/MAU) | Card | 352 | 120 | 264 | 64 |
| Activation rate | Card | 664 | 120 | 264 | 64 |
| Week-4 retention | Card | 976 | 120 | 264 | 64 |
| Active users by day | Line chart | 40 | 232 | 704 | 200 |
| Activation funnel | Funnel | 792 | 232 | 448 | 200 |
| Feature adoption | Bar chart | 40 | 480 | 456 | 200 |
| Retention by sign-up cohort | Matrix | 544 | 480 | 696 | 200 |
Custom visuals for this layout
Built-in Power BI visuals cover most slots above. These slots also suit a custom visual; each page covers the data shape, DAX and a prompt to generate it as a .pbiviz.
Slot: Daily active users
KPI CardExecutive dashboard KPI row (revenue, customers, NPS, churn)
Slot: Active users by day
Calendar HeatmapDaily sales or revenue intensity across the year
Slot: Activation funnel
Funnel ChartSales pipeline: leads → MQLs → SQLs → opportunities → closed won
Slot: Retention by sign-up cohort
HeatmapHour-of-day × day-of-week traffic or activity patterns
Already have a report?
Brand Makeover tries Product Analytics & Feature Adoption first on every page of your Power BI project (.pbip zip) where it fits: the page's visuals have to go into its 8 data slots without overlaps. Pages it can't seat get another catalog layout or a brand grid. Queries, filters and bookmarks are left as they are. Free, in your browser.
Opens with the Analyst / Dense preset, because the Executive preset doesn't use this layout (8 data slots; this preset uses templates with at most 7).
Restyle my report into thisSwap a slot for a custom visual
Pick any slot and VizForge AI writes a custom visual (.pbiviz, with TypeScript source) sized to it, in this template's colours and shaped for the fields it is bound to.
Generate one that fits this layout.
Card · 264×64 px · bound to [DAU]
1, 2 or 5 credits depending on the brief · 5 free on signup. Sign in or create a free account on the next screen; the brief is saved for 30 minutes.
A Power BI card visual titled "Daily active users". It sits in a 264×64 px slot on a designed report page. Match the report's brand: data colours #C6FF3D, #FF3DAD, #3DD6FF, #A26BFF, #FF9A3D, #3DFFB0; background #15151C; text #F4F4F8; font Segoe UI. Transparent visual background so the page design shows through; no visual border. In the sample model it is bound to [DAU]; keep the same data roles so the fields drop straight in.
Not sure what to build? Browse the visual catalog or open the template in the design studio and hand off any slot from there. Or start in the AI generator with a blank brief.
Colours and theme
Neon-on-carbon dark Power BI theme: electric lime, magenta, cyan and violet data colours on near-black for gaming, esports, tech-startup and launch dashboards.
Use the background in an existing report
Prefer to keep your own report? Apply the design to it instead of opening the PBIP.
- 1
Download the background
Take the 1920×1080 PNG for a new page in a Fluent 2 report (the default size for new pages), or the 2× PNG (2560×1440) for sharp text on a 1280×720 Classic page. Power BI scales the image to the canvas.
- 2
Set the canvas background
Format page → Canvas background → Browse. Set Image fit to Fill and transparency to 0%.
- 3
Import the theme
Design ribbon → Import theme (in the Power BI service: View → Theme pane), then pick the downloaded JSON. Data colours and fonts now match the design. Older Desktop builds: View → Themes → Browse for themes.
- 4
Place your visuals
Size each visual to the positions above with background and border off, or open the PBIP project where they are already placed.
Questions about this template
Does the Product Analytics & Feature Adoption template come with sample data?
Yes. The “PBIP with sample data” download contains a semantic model with 9 tables and 8 DAX measures, and every visual on the page is already bound to it. The sample: Six weeks of product usage for a fictional work-management app (to 31 Oct 2026): daily active users and trailing-28-day active users by plan and platform, monthly feature adoption among active accounts, an activation funnel for weekly sign-up cohorts, and week-by-week retention for six cohorts. The data is written into each table's Power Query step, so there is no data source or sign-in.
Is it a .pbix file?
It is a Power BI project (PBIP): a folder of text files that Power BI Desktop opens like a .pbix. Open the .pbip file, select Refresh once to load the sample rows, then use File → Save as if you want a single .pbix.
What visuals are in the Product Analytics & Feature Adoption template?
The page has 10 visual areas: 2 slicers, 4 cards, 1 line chart, 1 funnel, 1 bar chart, 1 matrix. Their exact positions are listed on this page so you can match them in Power BI's Format → General → Properties panel, or skip that step by downloading the PBIP project.
Which theme does the Product Analytics & Feature Adoption template use?
It ships with the Carbon Neon theme (dark tone). Download the theme JSON here, or open the template in the design studio and switch to any other theme or your own brand colours.
Is there a light version of the Product Analytics & Feature Adoption template?
Yes. Switch the preview to Light and every download (background, theme JSON and PBIP) comes in that version. The layout is identical; the page, card and text colours are re-solved for a light page, and the accent, status and data colours keep their hues but are adjusted until text meets WCAG AA (4.5:1) and chart colours reach 3:1 against the cards.
How do I use the background image in Power BI Desktop?
Select the page, open Format page → Canvas background, choose Browse and pick the PNG, then set Image fit to Fill and transparency to 0%. Give your visuals a transparent background and no border so the designed panels show through.
Can I open the PBIP project in Power BI Desktop?
Yes. PBIR is the default report format in Power BI Desktop since September 2026, and the download is a PBIP project: unzip it and open the .pbip file, select Refresh once and the sample data loads into visuals that are already bound (the empty PBIP leaves the containers unbound for your own data). Microsoft still lists projects and TMDL as preview features (as of Nov 2026), so if Desktop won't open it, enable them under File → Options and settings → Options → Preview features.
Build guides for this dashboard
Guides to the same dashboard job: which custom visuals it needs, the DAX behind them and prompts to generate them.
Dashboard job
Best Power BI Visuals for Product AnalyticsThe best Power BI visuals for product analytics — feature adoption funnels, retention cohorts, user flow…
Team
Power BI for saasMRR movement, cohort retention and net revenue retention: the subscription views a board deck and a growth review both need.
KPI cards for this layout
Headline numbers drawn by one DAX SVG measure each, for the Card visual or a table row.
Want the headline numbers to look like cards rather than plain values? Browse the KPI card gallery or build your own in the SVG measure builder.
Related templates
Keep exploring
61 hand-designed Power BI page layouts by department.
80 contrast-checked theme JSON files, light and dark.
Page backgrounds at 1280×720 and 1920×1080 with visual positions.
3,034 icons in 40 categories as SVG, PNG, DAX or theme icon JSON.
Make the Product Analytics & Feature Adoption template yours
Swap in your brand colours and logo, move panels, add icons and generate missing visuals with AI, then export the background, theme JSON and PBIP project.
The design studio for Power BI. Free, in your browser, no sign-up.