2 free templates · Insurance
Insurance dashboard templates for Power BI
Insurance templates
Each template downloads as a background image, a theme JSON and a PBIP project; the ones marked with sample data open in Power BI Desktop with bound visuals.
 With sample data
Insurance Claims
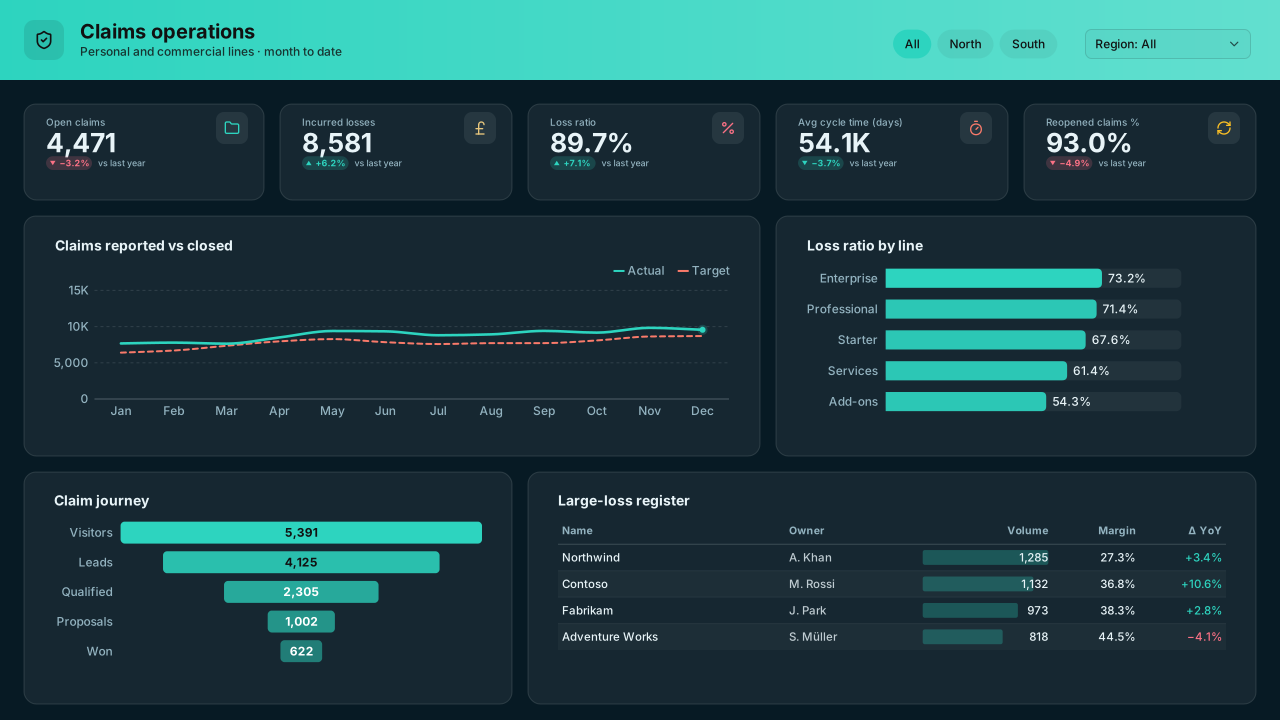
Dark Power BI insurance claims dashboard template: open claims, incurred losses, loss ratio and cycle time, a claim-journey funnel and large-loss register.Free for commercial use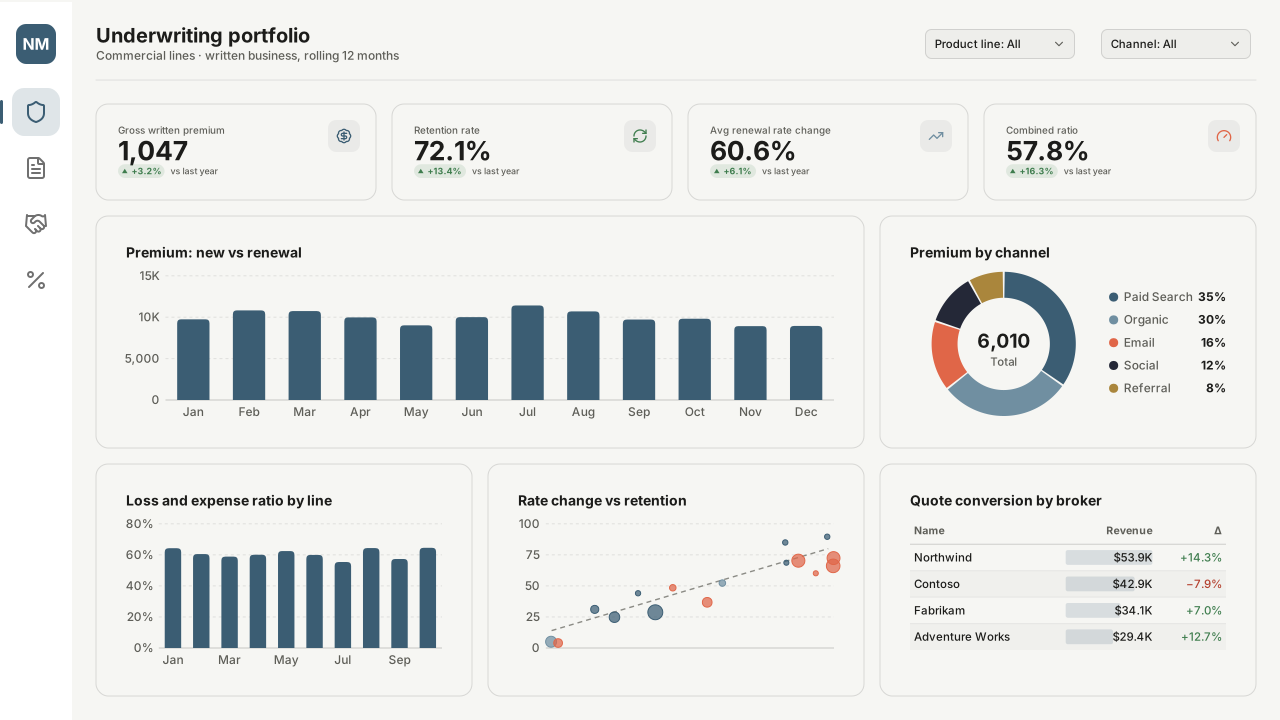 With sample data
Insurance Underwriting Portfolio
Power BI insurance underwriting dashboard template: gross written premium, retention, renewal rate change, combined ratio by line and broker quote conversion.Free for commercial use
More insurance layouts are on the way. Browse all templates or start from a blank page in the Design Studio.
What a insurance dashboard should answer
- What is the loss ratio by line of business, and is it moving?
- How many claims are open, and how long have they been open?
- Which quotes convert to bound policies, and at what price?
- Where are large losses coming from?
Layout advice
Separate frequency from severity: a loss ratio that worsens because of three large claims needs a different page from one driven by many small ones. Show claim ages in bands and keep reserves out of the same chart as paid amounts.
Check any layout with the Design Check in the Design Studio (contrast, grid, gutters), and pick a contrast-checked theme to match.
Beyond the template
Custom visuals and dashboard recipes for the same team.
Team hub
Power BI visuals for FinanceVariance bridges, balance-sheet smalls, scenario sliders — the finance visuals Power BI's native waterfall and cards don't cover.
Dashboard recipe
Best Power BI Visuals for an Insurance Claims DashboardThe best Power BI visuals for insurance claims — severity distributions, pipeline Sankeys, catastrophe event…
Templates for other departments
- Executive 1
- Finance 6
- Sales 3
- Marketing 4
- Retail & e-commerce 3
- SaaS 2
- Operations 4
- HR & people 5
- Supply chain 7
- Manufacturing 3
- Healthcare 3
- IT 3
- Project & PMO 2
- Aviation 1
- Banking 3
- Real estate & workplace 2
- Hospitality 2
- Education 2
- Nonprofit 1
- Public sector 1
- CV & portfolio 1
Keep exploring
61 hand-designed Power BI page layouts by department.
80 contrast-checked theme JSON files, light and dark.
Page backgrounds at 1280×720 and 1920×1080 with visual positions.
3,034 icons in 40 categories as SVG, PNG, DAX or theme icon JSON.
Make a insurance page your own
Open a template in the Design Studio to change colours, fonts, logo and layout, then export the background, theme JSON and PBIP project.
The design studio for Power BI. Free, in your browser, no sign-up.