7 free templates · Supply chain
Supply chain dashboard templates for Power BI
Supply chain templates
Each template downloads as a background image, a theme JSON and a PBIP project; the ones marked with sample data open in Power BI Desktop with bound visuals.
 With sample data
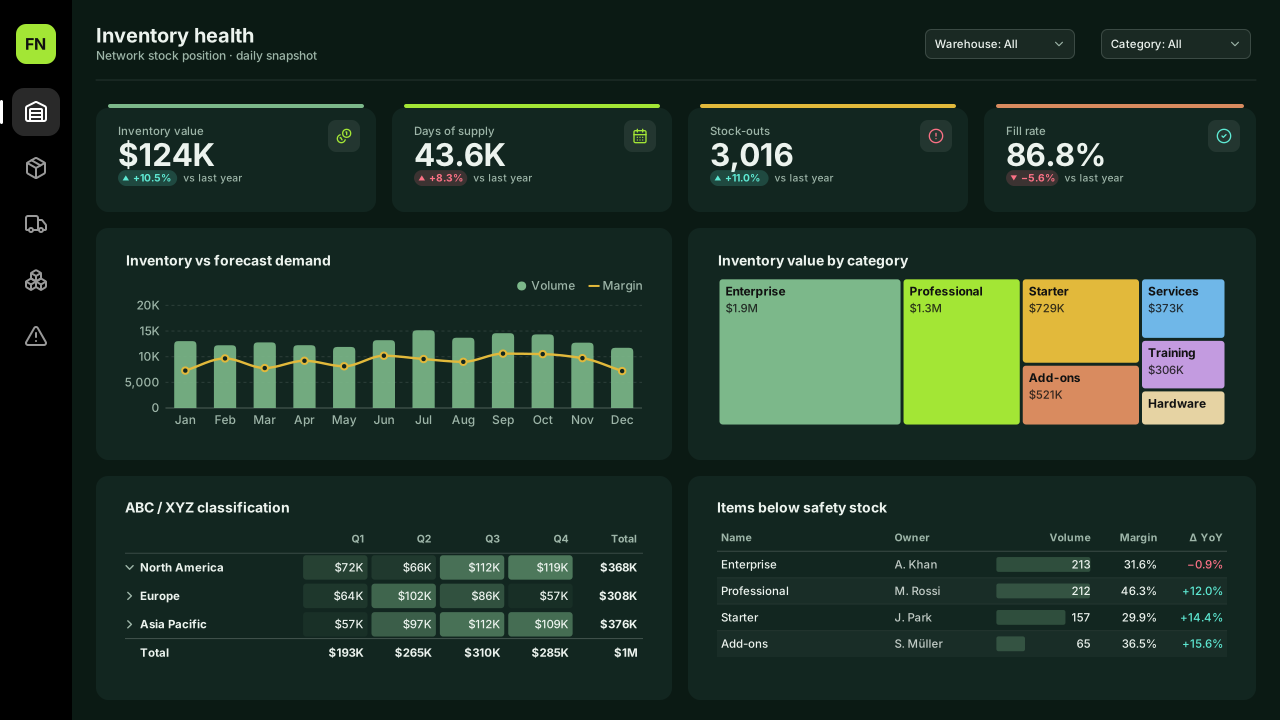
Supply Chain Inventory
Power BI inventory dashboard template: inventory value, days of supply, stock-outs and fill rate KPIs, inventory vs demand, a category treemap and stock alerts.Free for commercial use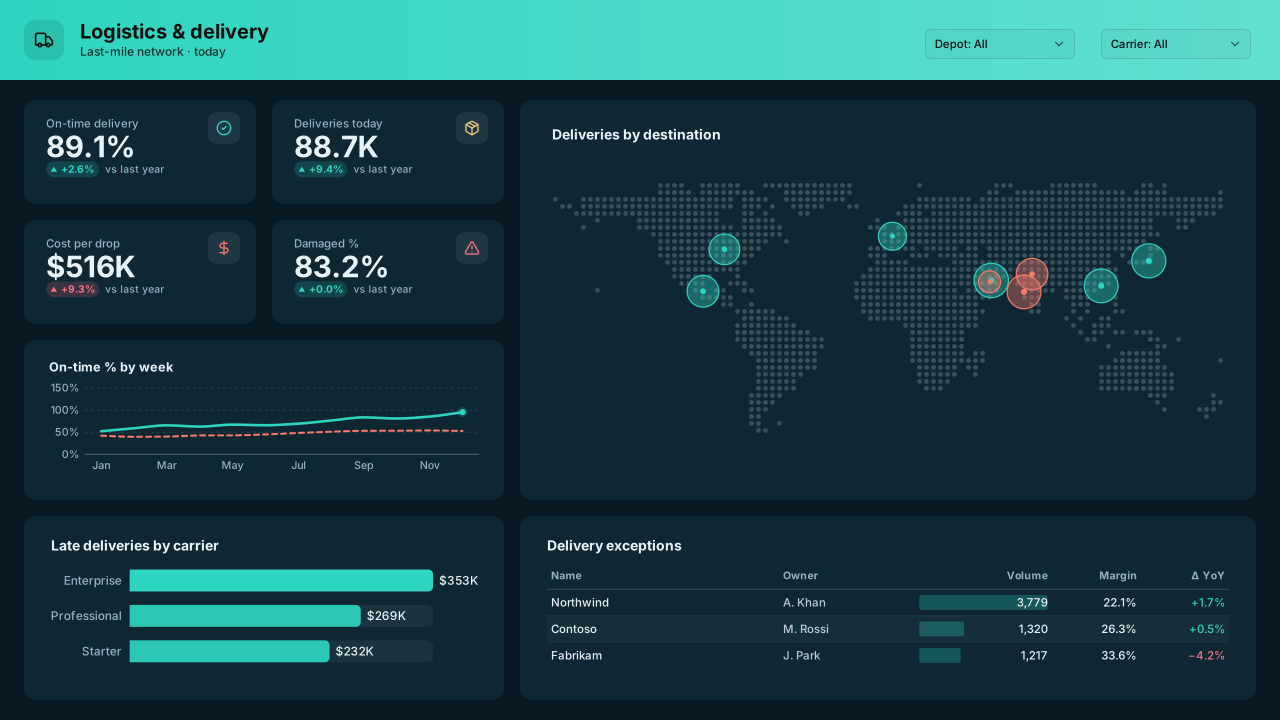 With sample data
Logistics & Delivery
Power BI logistics dashboard template: on-time delivery, drops, cost per drop and damage KPIs, a delivery map, late deliveries by carrier and exceptions.Free for commercial use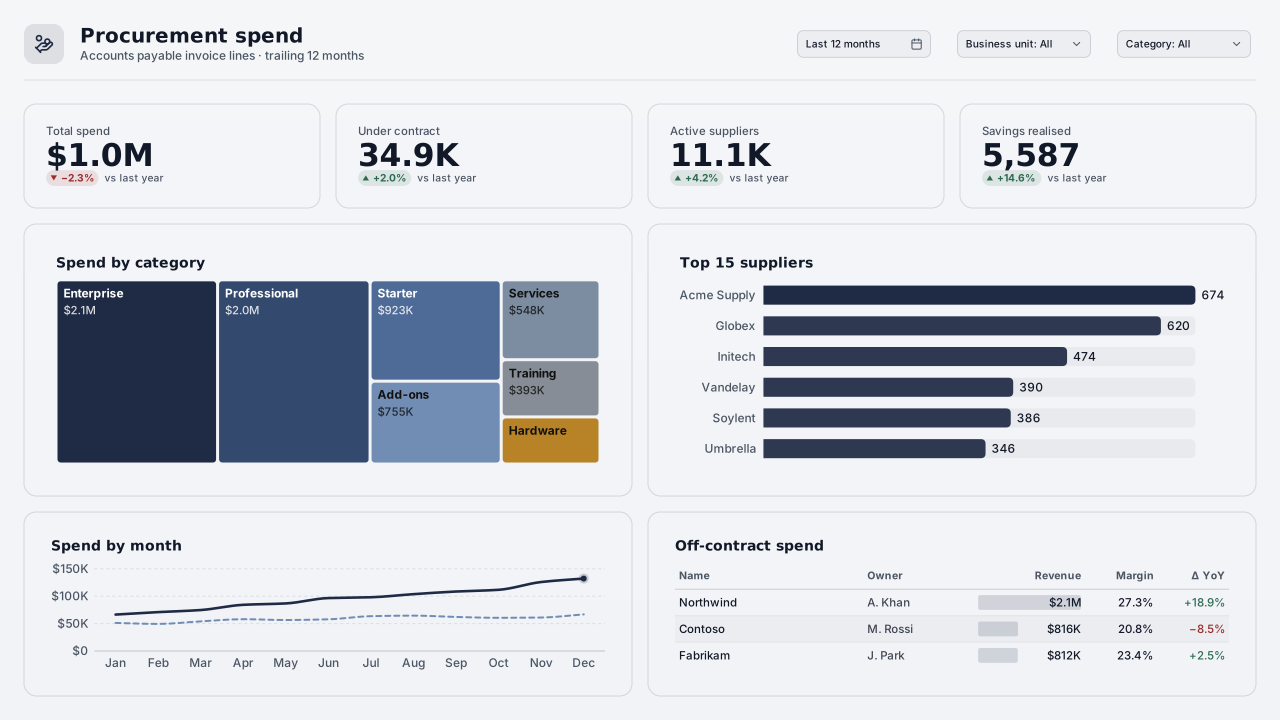 With sample data
Procurement Spend Analysis
Power BI procurement spend template: spend, contract coverage, supplier and savings KPIs, a category treemap, top suppliers and off-contract spend.Free for commercial use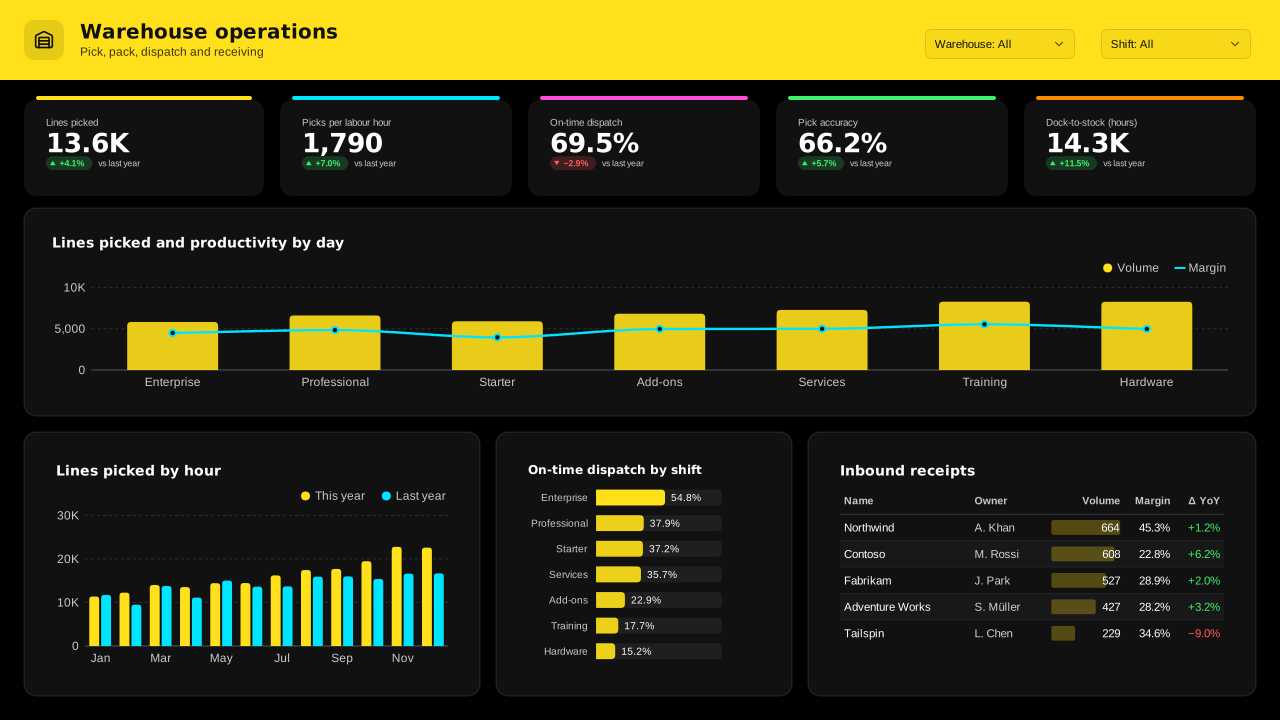 With sample data
Warehouse Operations
Dark Power BI warehouse dashboard template: lines picked, picks per labour hour, pick accuracy, on-time dispatch by shift, hourly volume and dock-to-stock.Free for commercial use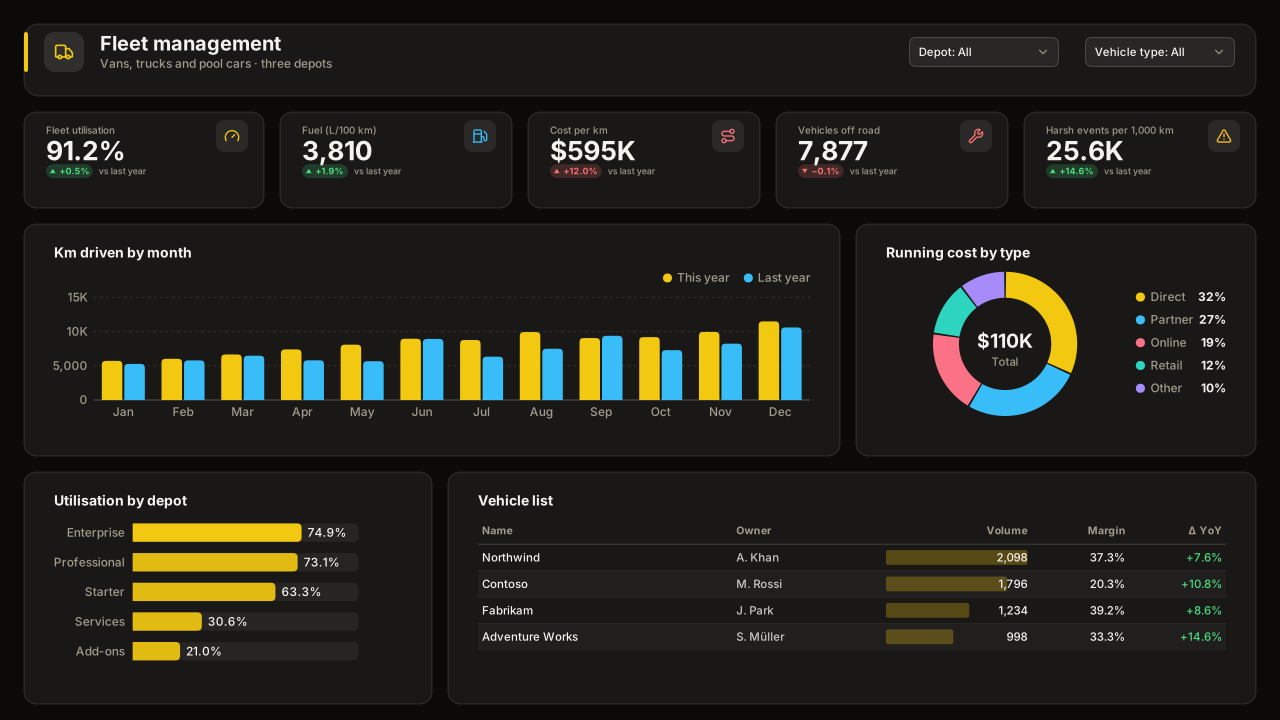 With sample data
Fleet Management
Dark Power BI fleet management dashboard template: utilisation, fuel economy, cost per km, vehicles off road, harsh driving, costs by type and a vehicle list.Free for commercial use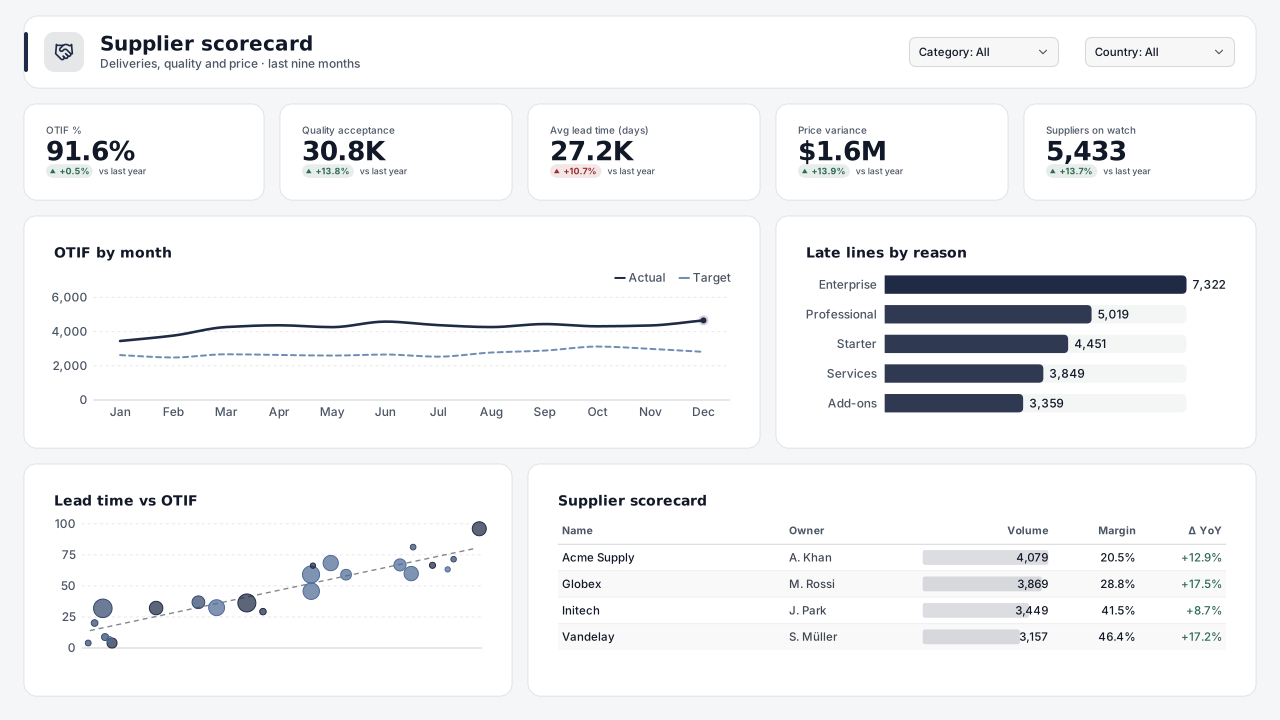 With sample data
Supplier Performance Scorecard
Power BI supplier scorecard template: OTIF, quality acceptance, lead time and price variance per supplier, late-delivery reasons and a weighted score.Free for commercial use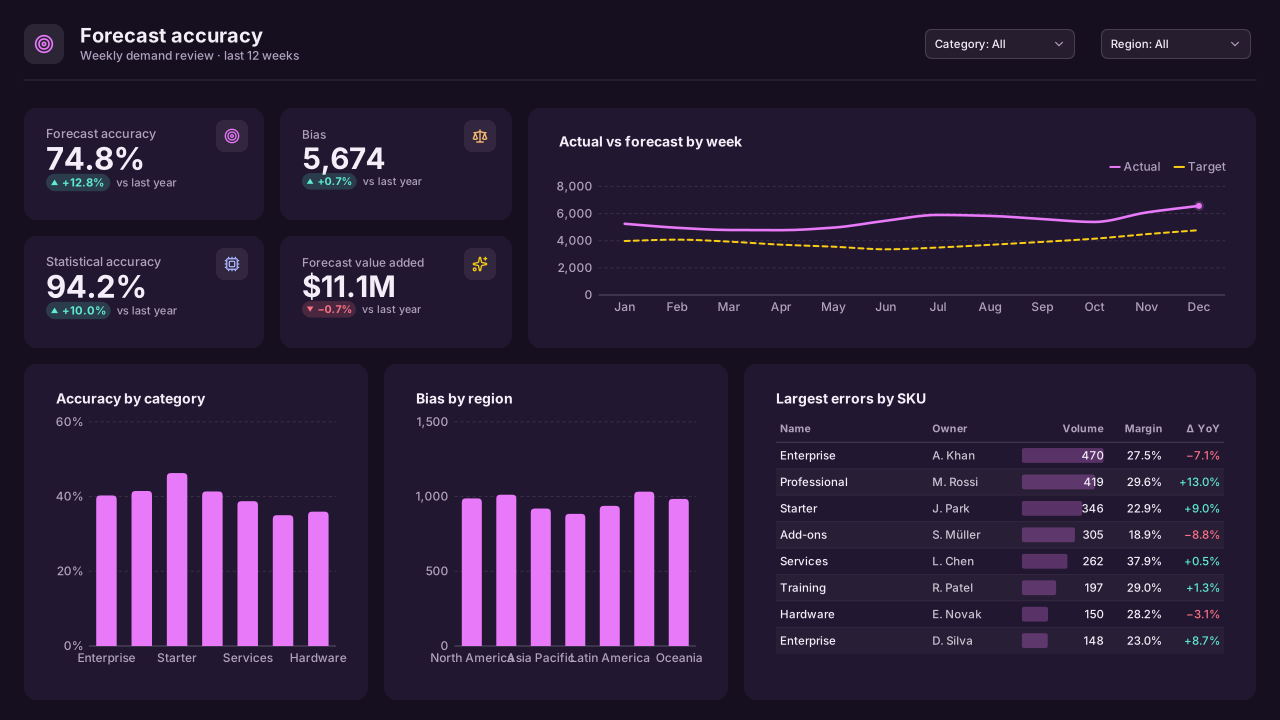 With sample data
Demand Forecast Accuracy
Dark Power BI demand planning template: forecast accuracy (1 − WMAPE), bias, statistical vs final forecast, forecast value added and largest SKU errors.Free for commercial use
What a supply chain dashboard should answer
- Which items are below safety stock, and where?
- Are deliveries on time and in full, by carrier and lane?
- How concentrated is spend across suppliers?
- Where are lead times getting longer?
Layout advice
Put the exceptions first: items at risk, late deliveries, suppliers over budget. Keep units explicit (units, pallets, value) because supply-chain data mixes them freely.
Check any layout with the Design Check in the Design Studio (contrast, grid, gutters), and pick a contrast-checked theme to match.
Beyond the template
Custom visuals and dashboard recipes for the same team.
Team hub
Power BI visuals for Supply ChainOn-time-in-full, inventory cover and supplier spend: the flow views planners and buyers check before the daily stand-up.
Dashboard recipe
Best Power BI Visuals for Supply Chain KPIsThe best Power BI visuals for supply chain KPIs — OTIF bullets, inventory SPC, network flow, OTD…
Templates for other departments
- Executive 1
- Finance 6
- Sales 3
- Marketing 4
- Retail & e-commerce 3
- SaaS 2
- Operations 4
- HR & people 5
- Manufacturing 3
- Healthcare 3
- IT 3
- Project & PMO 2
- Aviation 1
- Banking 3
- Insurance 2
- Real estate & workplace 2
- Hospitality 2
- Education 2
- Nonprofit 1
- Public sector 1
- CV & portfolio 1
Keep exploring
61 hand-designed Power BI page layouts by department.
80 contrast-checked theme JSON files, light and dark.
Page backgrounds at 1280×720 and 1920×1080 with visual positions.
3,034 icons in 40 categories as SVG, PNG, DAX or theme icon JSON.
Make a supply chain page your own
Open a template in the Design Studio to change colours, fonts, logo and layout, then export the background, theme JSON and PBIP project.
The design studio for Power BI. Free, in your browser, no sign-up.