2 free templates · Education
Education dashboard templates for Power BI
Education templates
Each template downloads as a background image, a theme JSON and a PBIP project; the ones marked with sample data open in Power BI Desktop with bound visuals.
 With sample data
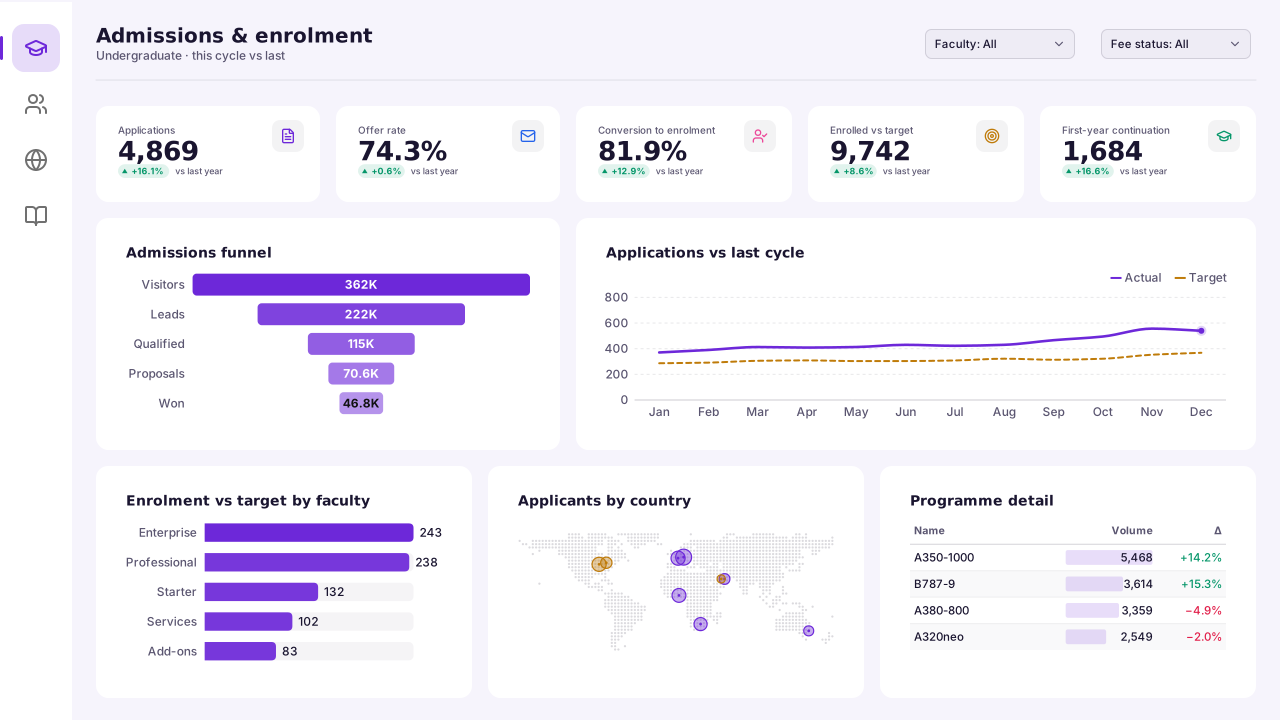
University Admissions & Enrolment
Power BI university admissions dashboard template: applications vs last cycle, admissions funnel, enrolment vs target, applicant countries and continuation.Free for commercial use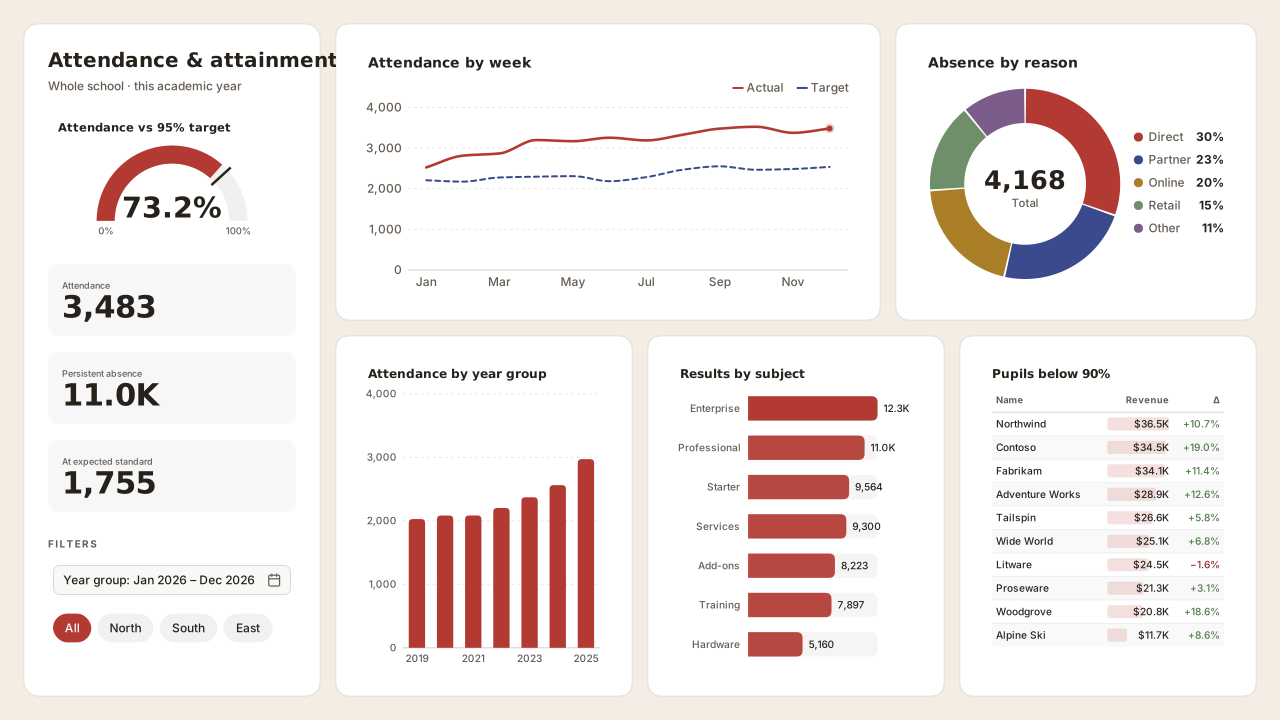 With sample data
School Attendance & Attainment
Power BI school attendance dashboard template: attendance vs 95% target, persistent absence, pupil-premium gap, absence reasons, results by subject.Free for commercial use
More education layouts are on the way. Browse all templates or start from a blank page in the Design Studio.
What a education dashboard should answer
- How many applicants convert to enrolled students, and where do they drop out?
- Which programmes are under or over their intake target?
- What share of pupils is persistently absent, by year group?
- Which weeks and days show the lowest attendance?
Layout advice
Present cohort data with small counts carefully: hide or band groups below a minimum size so no individual pupil can be identified. Show attendance against the threshold line your authority uses, labelled.
Check any layout with the Design Check in the Design Studio (contrast, grid, gutters), and pick a contrast-checked theme to match.
Templates for other departments
- Executive 1
- Finance 6
- Sales 3
- Marketing 4
- Retail & e-commerce 3
- SaaS 2
- Operations 4
- HR & people 5
- Supply chain 7
- Manufacturing 3
- Healthcare 3
- IT 3
- Project & PMO 2
- Aviation 1
- Banking 3
- Insurance 2
- Real estate & workplace 2
- Hospitality 2
- Nonprofit 1
- Public sector 1
- CV & portfolio 1
Keep exploring
61 hand-designed Power BI page layouts by department.
80 contrast-checked theme JSON files, light and dark.
Page backgrounds at 1280×720 and 1920×1080 with visual positions.
3,034 icons in 40 categories as SVG, PNG, DAX or theme icon JSON.
Make a education page your own
Open a template in the Design Studio to change colours, fonts, logo and layout, then export the background, theme JSON and PBIP project.
The design studio for Power BI. Free, in your browser, no sign-up.