4 free templates · Operations
Operations dashboard templates for Power BI
Operations templates
Each template downloads as a background image, a theme JSON and a PBIP project; the ones marked with sample data open in Power BI Desktop with bound visuals.
 With sample data
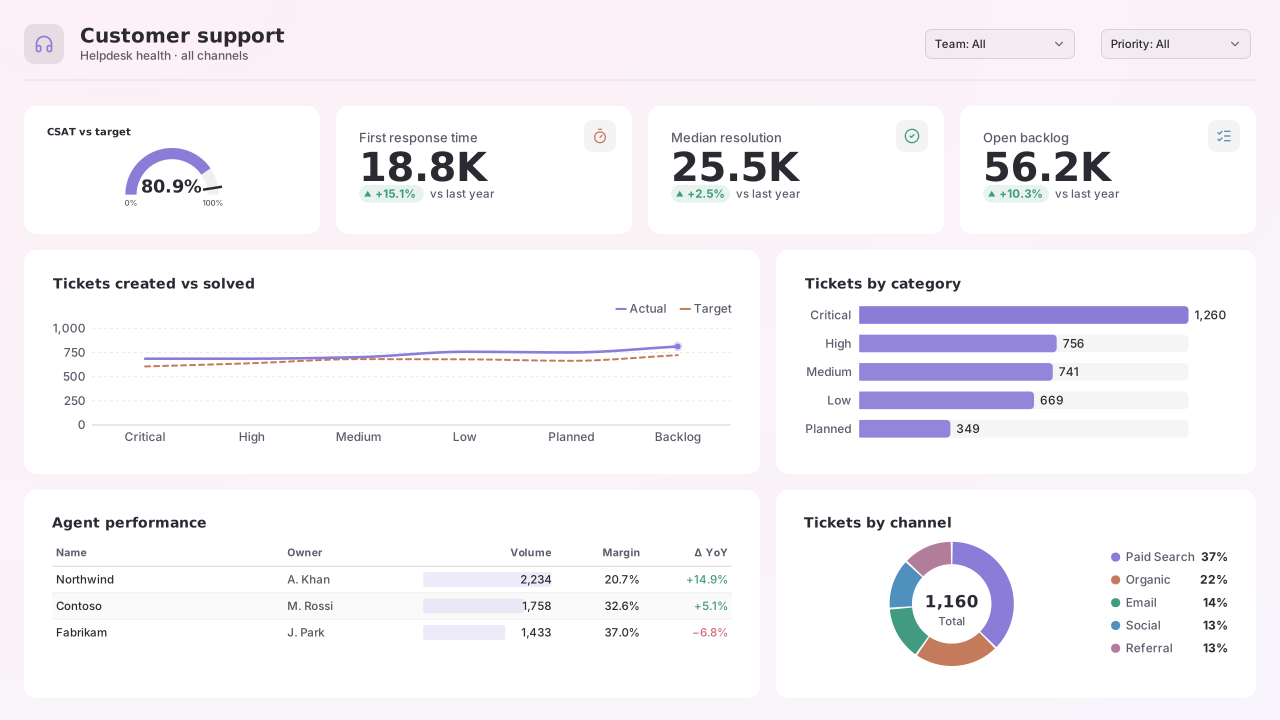
Customer Support
Power BI customer support dashboard template: CSAT gauge, response and resolution time KPIs, created vs solved trend, ticket categories and agent table.Free for commercial use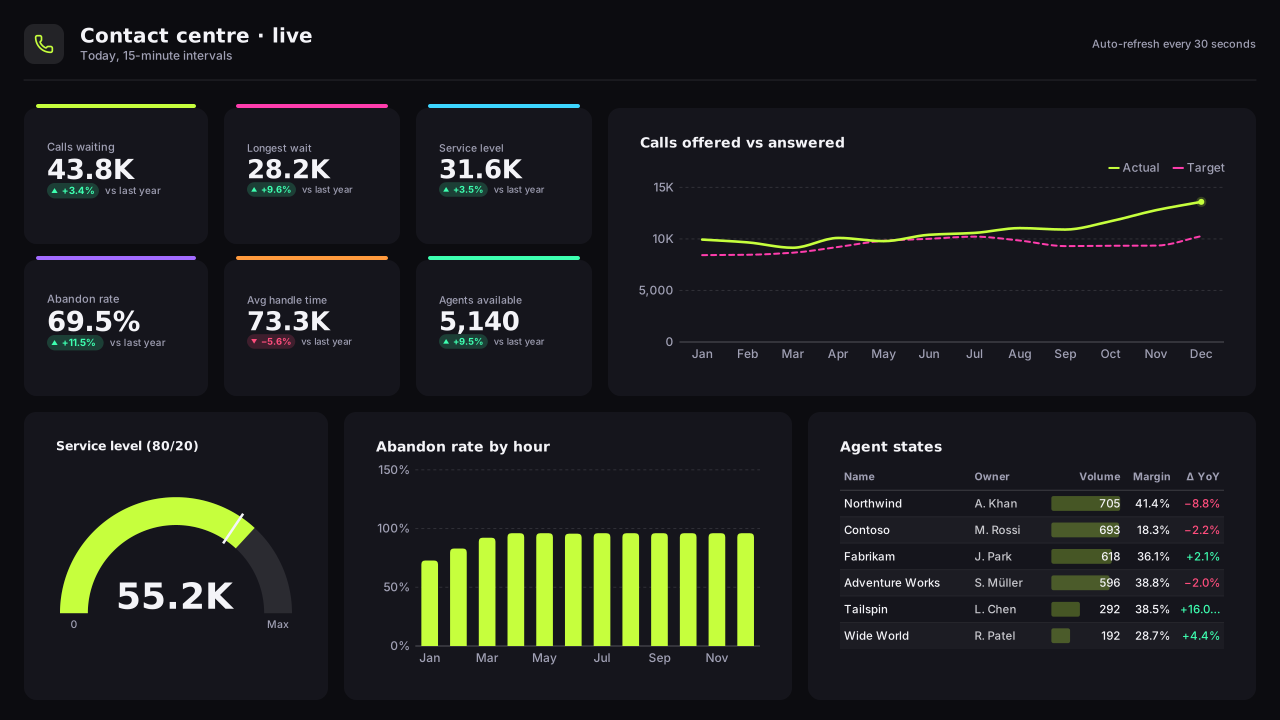 With sample data
Call Centre Operations
Dark Power BI call centre wallboard template: six live KPI tiles, calls offered vs answered by interval, service-level gauge and agent states.Free for commercial use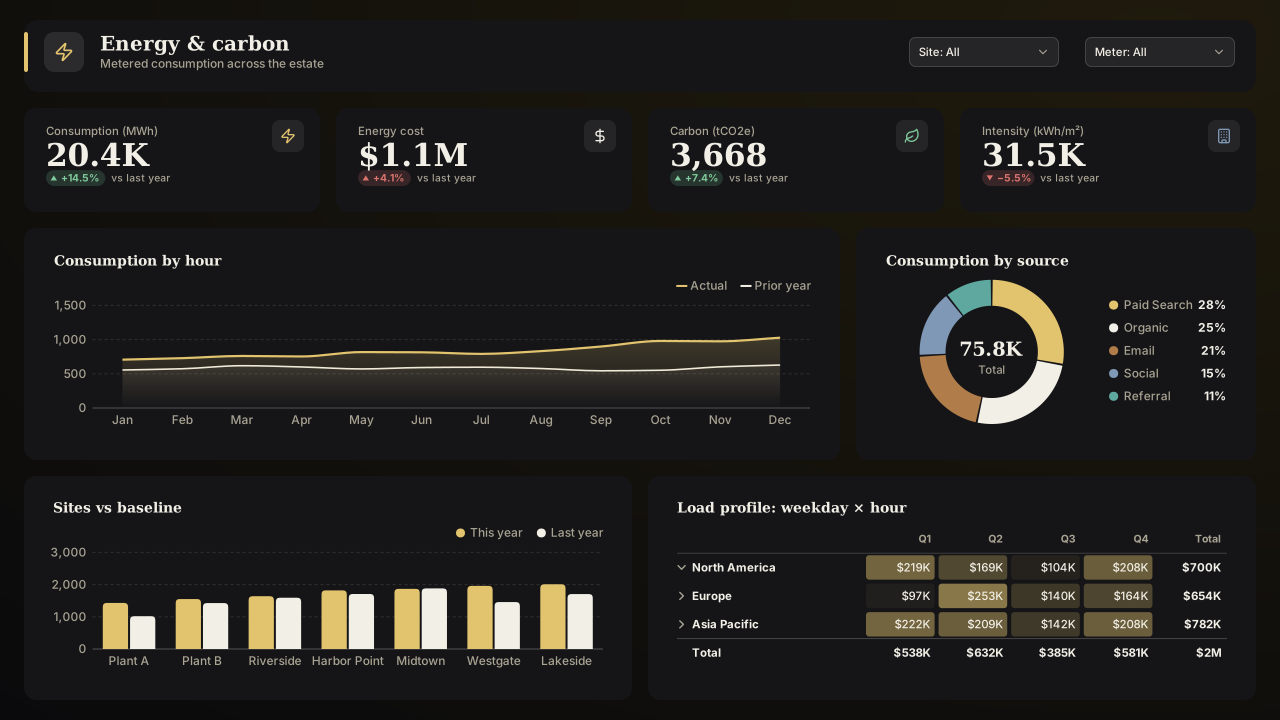 With sample data
Energy Consumption
Power BI energy and sustainability dashboard template: kWh, cost, carbon and intensity KPIs, hourly load, source mix, site vs baseline and load-profile heatmap.Free for commercial use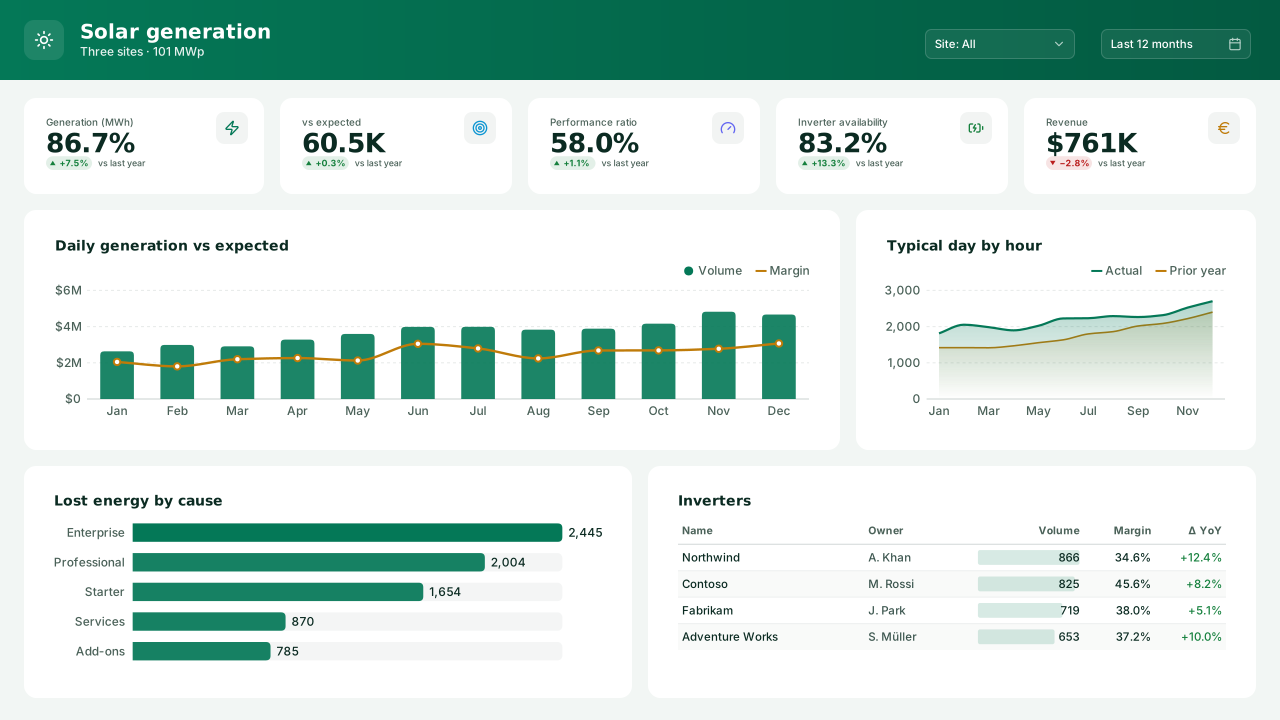 With sample data
Solar Generation
Power BI solar PV dashboard template: generation vs expected, performance ratio, inverter availability, typical-day profile, lost energy by cause and revenue.Free for commercial use
More operations layouts are on the way. Browse all templates or start from a blank page in the Design Studio.
What a operations dashboard should answer
- Are we meeting the service level right now and over the week?
- When do volumes peak, and are we staffed for it?
- Which teams or queues are behind?
- What is driving cost or consumption up?
Layout advice
Operations pages are often on a wall screen: use larger type, fewer visuals and put the service-level card where people look first. Hour-by-day patterns read best as a heatmap rather than many lines.
Check any layout with the Design Check in the Design Studio (contrast, grid, gutters), and pick a contrast-checked theme to match.
Beyond the template
Custom visuals and dashboard recipes for the same team.
Team hub
Power BI visuals for OperationsOEE gauges, defect Paretos, shift heatmaps — the floor-ready visuals Power BI doesn't ship natively (as of November 2026).
Dashboard recipe
Best Power BI Visuals for a Customer Success DashboardThe best Power BI visuals for customer success — health scorecards, retention cohorts, expansion Sankeys, NPS…
Dashboard recipe
Best Power BI Visuals for Supply Chain KPIsThe best Power BI visuals for supply chain KPIs — OTIF bullets, inventory SPC, network flow, OTD…
Templates for other departments
- Executive 1
- Finance 6
- Sales 3
- Marketing 4
- Retail & e-commerce 3
- SaaS 2
- HR & people 5
- Supply chain 7
- Manufacturing 3
- Healthcare 3
- IT 3
- Project & PMO 2
- Aviation 1
- Banking 3
- Insurance 2
- Real estate & workplace 2
- Hospitality 2
- Education 2
- Nonprofit 1
- Public sector 1
- CV & portfolio 1
Keep exploring
61 hand-designed Power BI page layouts by department.
80 contrast-checked theme JSON files, light and dark.
Page backgrounds at 1280×720 and 1920×1080 with visual positions.
3,034 icons in 40 categories as SVG, PNG, DAX or theme icon JSON.
Make a operations page your own
Open a template in the Design Studio to change colours, fonts, logo and layout, then export the background, theme JSON and PBIP project.
The design studio for Power BI. Free, in your browser, no sign-up.