2 free templates · SaaS
SaaS metrics dashboard templates for Power BI
SaaS templates
Each template downloads as a background image, a theme JSON and a PBIP project; the ones marked with sample data open in Power BI Desktop with bound visuals.
 With sample data
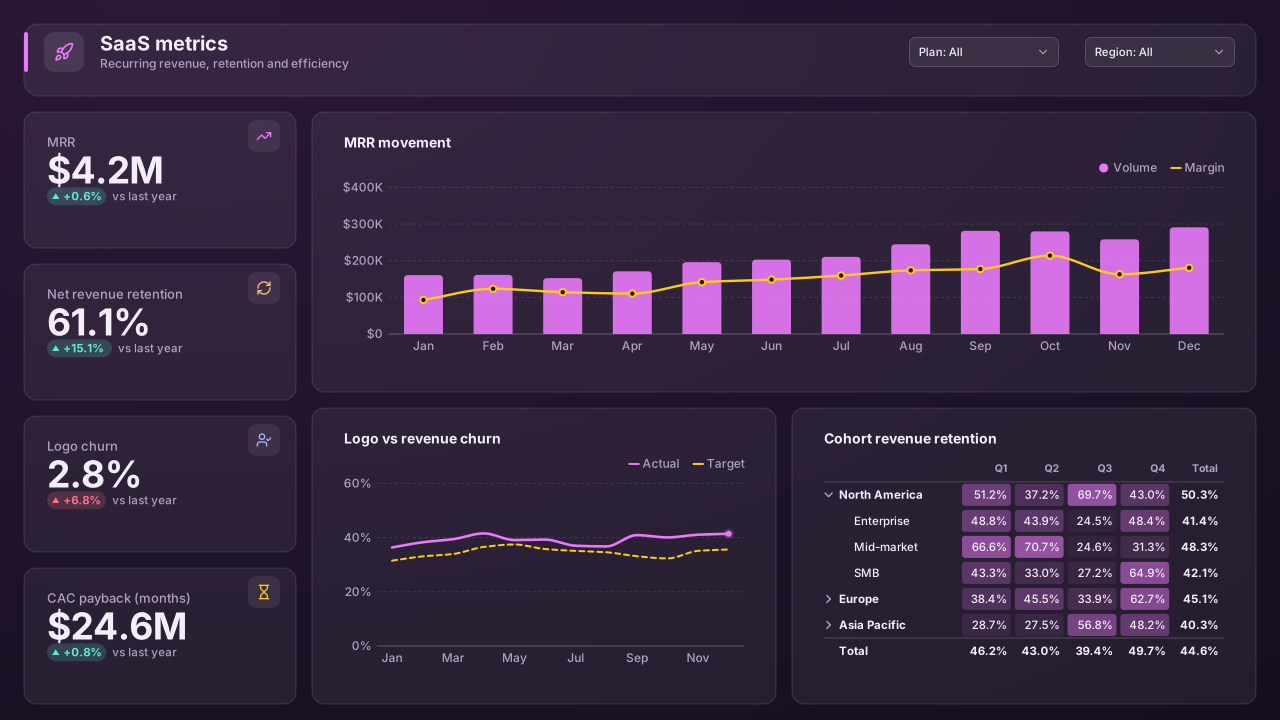
SaaS Metrics: MRR & Churn
Power BI SaaS metrics dashboard template: MRR, net revenue retention, churn and CAC payback KPIs, MRR movement chart, churn trend and cohort retention matrix.Free for commercial use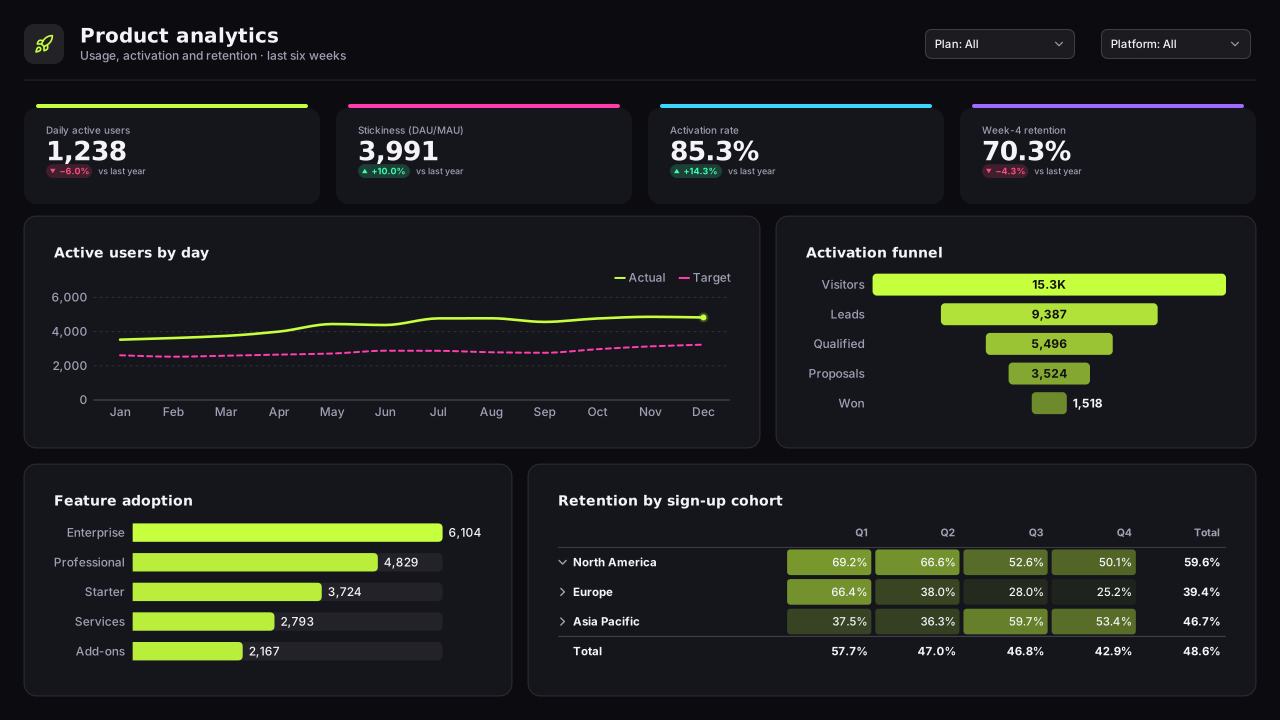 With sample data
Product Analytics & Feature Adoption
Dark Power BI product analytics template: DAU, stickiness (DAU/MAU), activation funnel, feature adoption by plan and a week-by-week retention cohort table.Free for commercial use
More saas layouts are on the way. Browse all templates or start from a blank page in the Design Studio.
What a saas dashboard should answer
- How did MRR move this month (new, expansion, contraction, churn)?
- How do signup cohorts retain over time?
- Which plans and segments drive net revenue retention?
- Are acquisition costs paid back fast enough?
Layout advice
Show MRR movement as a bridge in the order finance reports it, and keep the cohort grid square with months-since-signup on the columns. Label whether churn is logo or revenue churn on every card.
Check any layout with the Design Check in the Design Studio (contrast, grid, gutters), and pick a contrast-checked theme to match.
Beyond the template
Custom visuals and dashboard recipes for the same team.
Team hub
Power BI visuals for SaaSMRR movement, cohort retention and net revenue retention: the subscription views a board deck and a growth review both need.
Dashboard recipe
Best Power BI Visuals for SaaS MetricsThe best Power BI visuals for SaaS metrics — MRR waterfall, ARR cohorts, NRR Sankey, pipeline…
Dashboard recipe
Best Power BI Visuals for a Customer Success DashboardThe best Power BI visuals for customer success — health scorecards, retention cohorts, expansion Sankeys, NPS…
Templates for other departments
- Executive 1
- Finance 6
- Sales 3
- Marketing 4
- Retail & e-commerce 3
- Operations 4
- HR & people 5
- Supply chain 7
- Manufacturing 3
- Healthcare 3
- IT 3
- Project & PMO 2
- Aviation 1
- Banking 3
- Insurance 2
- Real estate & workplace 2
- Hospitality 2
- Education 2
- Nonprofit 1
- Public sector 1
- CV & portfolio 1
Keep exploring
61 hand-designed Power BI page layouts by department.
80 contrast-checked theme JSON files, light and dark.
Page backgrounds at 1280×720 and 1920×1080 with visual positions.
3,034 icons in 40 categories as SVG, PNG, DAX or theme icon JSON.
Make a saas page your own
Open a template in the Design Studio to change colours, fonts, logo and layout, then export the background, theme JSON and PBIP project.
The design studio for Power BI. Free, in your browser, no sign-up.