3 free templates · Sales
Sales dashboard templates for Power BI
Sales templates
Each template downloads as a background image, a theme JSON and a PBIP project; the ones marked with sample data open in Power BI Desktop with bound visuals.
 With sample data
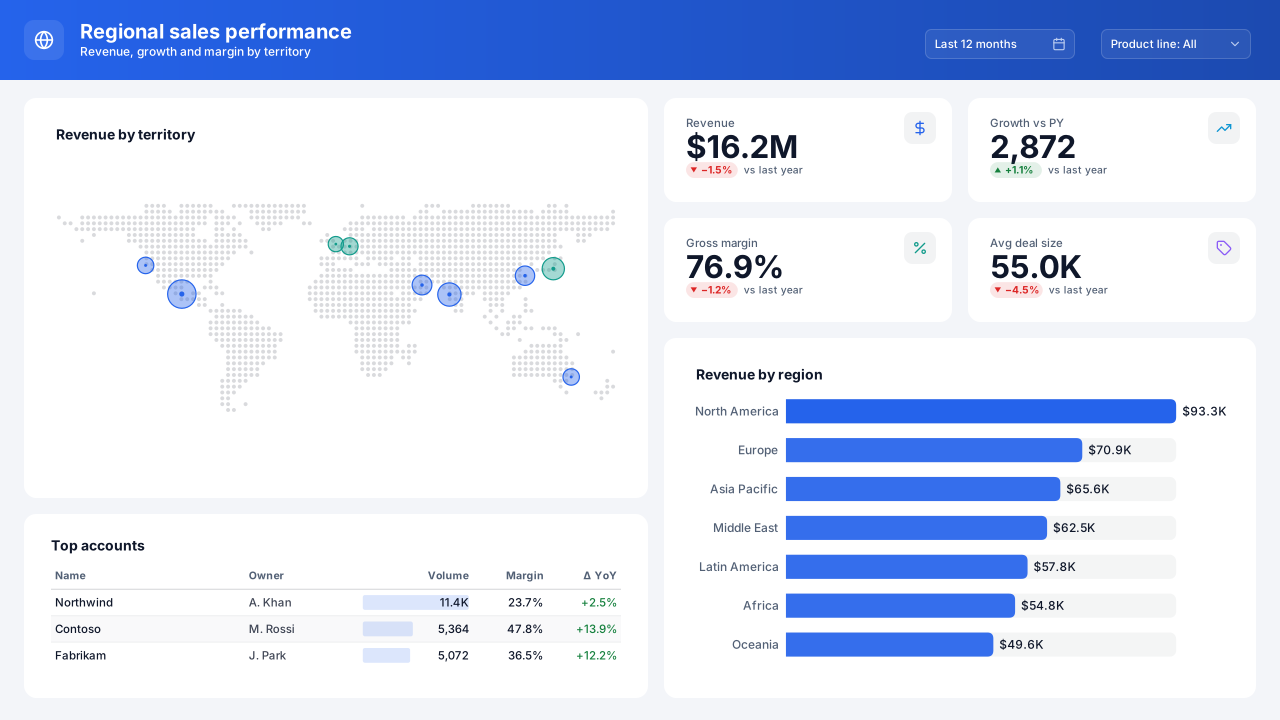
Regional Sales Performance
Power BI regional sales dashboard template: a large sales map, four KPIs, revenue by region bars and a top-accounts table on one page.Free for commercial use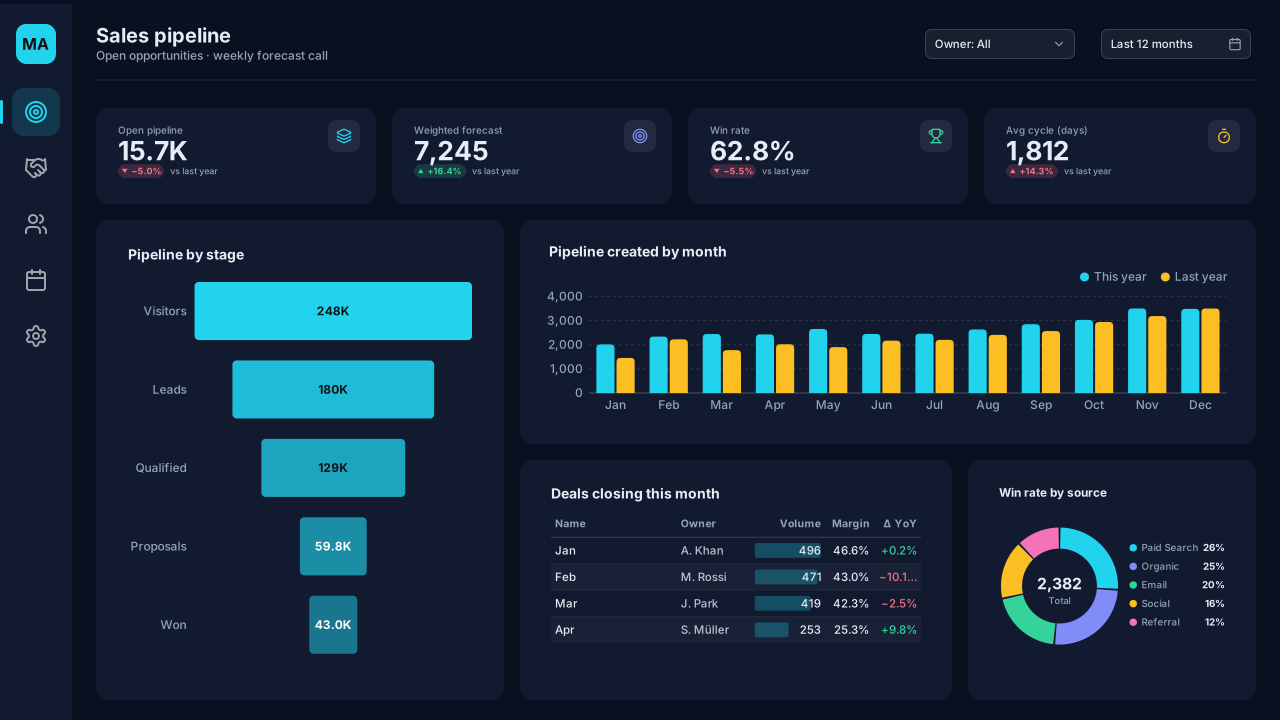 With sample data
Sales Pipeline
Power BI sales pipeline dashboard template with pipeline value, win rate and cycle-time KPIs, a stage funnel, pipeline creation trend and closing deals.Free for commercial use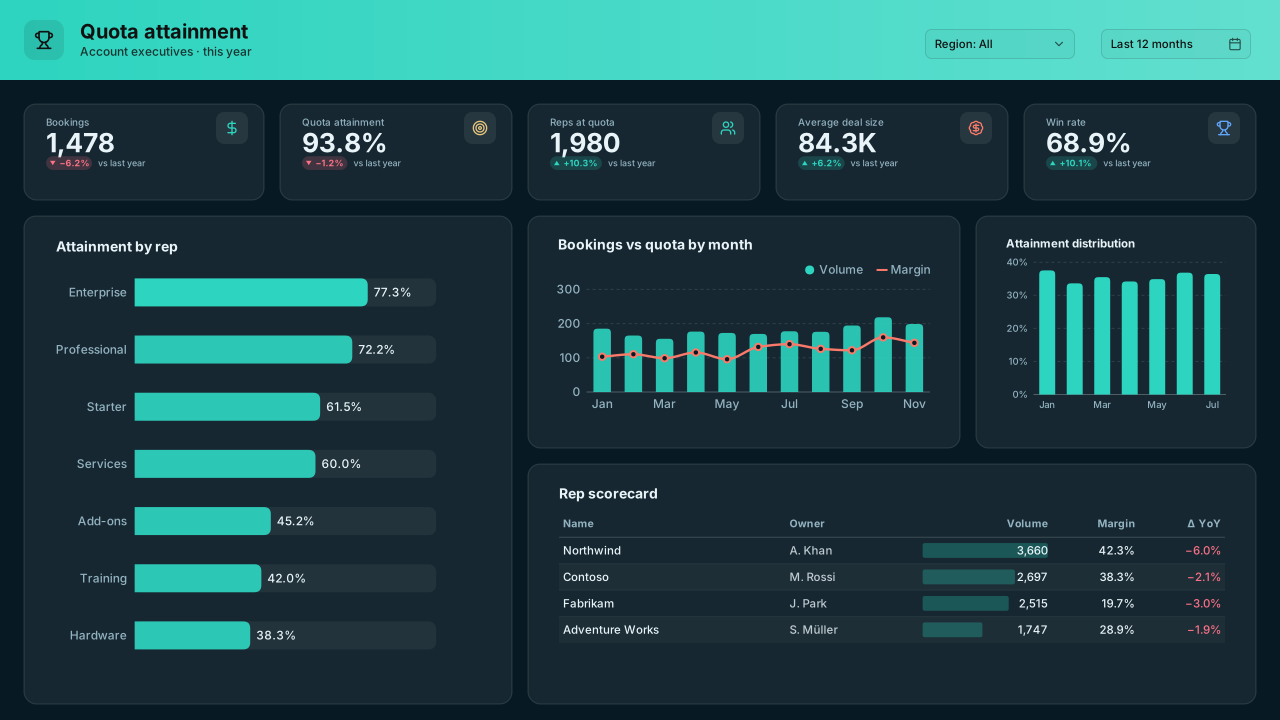 With sample data
Sales Rep Quota Attainment
Dark Power BI sales quota attainment template: a rep leaderboard, bookings vs quota by month, attainment distribution, win rate and deal size per rep.Free for commercial use
More sales layouts are on the way. Browse all templates or start from a blank page in the Design Studio.
What a sales dashboard should answer
- How much pipeline is there by stage, and is it enough to hit the quarter?
- Which reps and regions are on track against quota?
- Where do deals stall or drop out?
- What moved in the pipeline since last week?
Layout advice
Put the period selector and territory slicer in the header so every visual answers for the same scope. Rank tables by attainment rather than by name, and keep the pipeline chart in stage order left to right.
Check any layout with the Design Check in the Design Studio (contrast, grid, gutters), and pick a contrast-checked theme to match.
Beyond the template
Custom visuals and dashboard recipes for the same team.
Team hub
Power BI visuals for SalesPipeline by stage, attainment against quota and where deals stall: the sales views a forecast call actually needs.
Dashboard recipe
Best Power BI Visuals for a Sales DashboardThe best Power BI visuals for a sales dashboard: pipeline funnel, KPI cards, bullet charts, territory…
Templates for other departments
- Executive 1
- Finance 6
- Marketing 4
- Retail & e-commerce 3
- SaaS 2
- Operations 4
- HR & people 5
- Supply chain 7
- Manufacturing 3
- Healthcare 3
- IT 3
- Project & PMO 2
- Aviation 1
- Banking 3
- Insurance 2
- Real estate & workplace 2
- Hospitality 2
- Education 2
- Nonprofit 1
- Public sector 1
- CV & portfolio 1
Keep exploring
61 hand-designed Power BI page layouts by department.
80 contrast-checked theme JSON files, light and dark.
Page backgrounds at 1280×720 and 1920×1080 with visual positions.
3,034 icons in 40 categories as SVG, PNG, DAX or theme icon JSON.
Make a sales page your own
Open a template in the Design Studio to change colours, fonts, logo and layout, then export the background, theme JSON and PBIP project.
The design studio for Power BI. Free, in your browser, no sign-up.