Component library · 8 designs
Power BI UX helpers: empty states, notes and legends
The pieces that explain a page are easy to skip and are what readers ask about most: what a number means, why a chart is blank, where the data comes from and whom to ask.
These helpers are mostly text and shapes for the background image, plus native buttons where an action helps (clear filters, open a help page).
By Nawaf Sharaf · Founder & Reliability Engineer · Updated
Free for commercial useEmpty state with reset
What a panel shows when the filters leave nothing: an icon, one line on why and a Clear filters button. Place it under a visual and show it with a bookmark or a blank-aware measure.
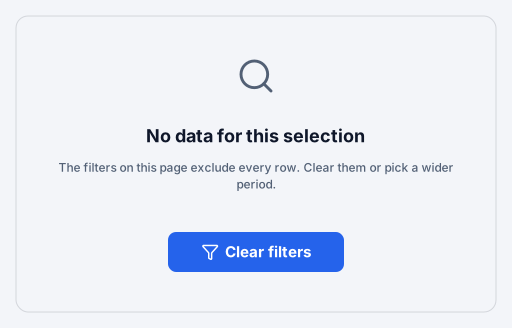
Native Power BI visuals: Button.
Positions on a 1280 × 720 page
Visual X Y Width Height Clear filters (Button) 552 416 176 40 Info note on a KPI
A KPI card with an info icon and a one-line definition under the number, so readers don't have to ask how it is calculated. Power BI's own tooltip can repeat the same text.
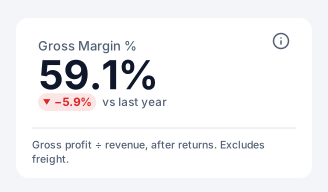
Native Power BI visuals: Card.
Positions on a 1280 × 720 page
Visual X Y Width Height Gross Margin % (Card) 40 128 232 88 Section divider
A section heading with a short accent mark, a hairline and one line of context. Splits a long or tall scrolling page into named parts.

Background artwork only: no visual containers.
Data note banner
A tinted banner with an alert icon for the one caveat readers must see: a late data feed, a restated month, a definition change. Delete it when the note no longer applies.

Background artwork only: no visual containers.
Shared legend
One legend drawn once above a group of charts that all use the same series, instead of repeating it in every visual. Colours follow the theme's first three data colours.

Background artwork only: no visual containers.
Status key
A key for good, neutral and bad states that spells out each threshold, so status colours never have to be guessed and still read in greyscale.

Background artwork only: no visual containers.
Footer with sources
A footer line with the data source, the refresh time and a definitions note. Answers where the numbers come from on every page without a separate notes page.

Background artwork only: no visual containers.
Help link button
A small Help button that opens a web page (your wiki or a how-to) in a new tab, next to a short prompt. Replace the placeholder address in the inspector; only https links are exported.

Native Power BI visuals: Button.
Positions on a 1280 × 720 page
Visual X Y Width Height Help (Button) 1152 28 104 40
Design rules for ux helpers
- Explain the number where it is
A one-line definition under a KPI is read; a Notes page is not.
- Never leave a blank panel
When filters return nothing, tell readers why and how to get data back.
- Status needs more than colour
Pair good, neutral and bad colours with an icon and a word so they read in greyscale and for colour-blind readers.
Add a component to your report
- 1
Pick a theme and download
Choose a theme above (or open the component in the Design Studio to use your own brand kit), then download the page folder (.zip).
- 2
Save your report as a .pbip
In Power BI Desktop, File → Save as → Power BI project (.pbip) with the PBIR format, then close Desktop.
- 3
Copy the page folder in
Copy definition/pages/<page> into <YourReport>.Report/definition/pages/, add the page name to pageOrder in pages.json, and register the background PNG in report.json. INSTRUCTIONS.md in the zip has the exact JSON.
- 4
Reopen and connect fields
Reopen the .pbip. The background and every native visual are placed; drag your fields onto slicers and charts, set button actions that need a target (a page or bookmark) and create bookmarks for bookmark navigators.
Frequently asked questions
Are these ux helpers images or real Power BI visuals?
Both, split the way Power BI works: shapes, text and icons go into the page background image; slicers, page navigators, bookmark navigators, buttons and chart placeholders are real visual containers in the PBIR page folder. 3 of the 8 designs on this page include native visuals.
Do they use my brand colours?
Yes. Every component is drawn from the brand kit's colour roles (page, surface, text, muted, accent, status and data colours) and fonts. Pick a theme here, or open a component in the Design Studio and set your colours, fonts and logo in the Brand panel before exporting.
Can I add one to a page I already designed?
Yes. In the Design Studio, open Insert → Components and click a component: it is drawn in your design's brand and placed where it belongs on the page (a header at the top, a footer at the bottom), scaled to your page size.
Which Power BI Desktop version do I need?
The page folder uses the PBIR report format, the default report format from the September 2026 Power BI Desktop release; older reports can be saved as PBIR with File → Save as → Power BI project. The page-folder export is in beta until we finish checking it in Desktop.