Component library · 8 designs
Power BI page layout grids
A grid decides how much of the page each question gets. Every layout here sits on Power BI's 1280 × 720 page with 24 px margins, 16 px gutters and every edge on an 8 px grid, so visuals line up when you type their sizes into Format → General → Properties.
Each panel is a card in the background image with a visual container placed inside it; download the page folder and the containers are already sized and positioned.
By Nawaf Sharaf · Founder & Reliability Engineer · Updated
Free for commercial useFour KPIs over two charts
The most common report page: a row of four KPI cards, then two equal charts. Reads top to bottom from the headline numbers to what drives them.
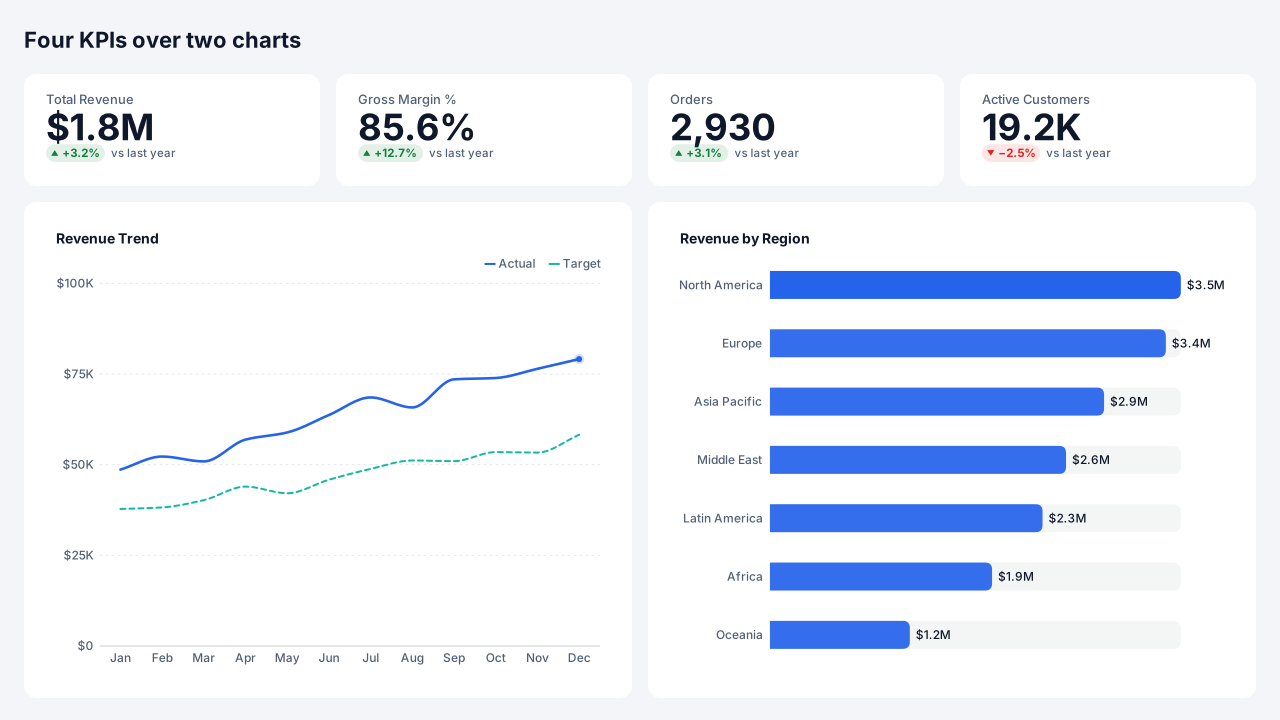
Native Power BI visuals: Card × 4, Line chart, Bar chart.
Positions on a 1280 × 720 page
Visual X Y Width Height Total Revenue (Card) 40 88 264 80 Gross Margin % (Card) 352 88 264 80 Orders (Card) 664 88 264 80 Active Customers (Card) 976 88 264 80 Revenue Trend (Line chart) 40 216 576 464 Revenue by Region (Bar chart) 664 216 576 464 Hero chart with side stack
One large chart over two thirds of the width and two smaller panels stacked beside it. Use when one question matters more than the rest of the page.
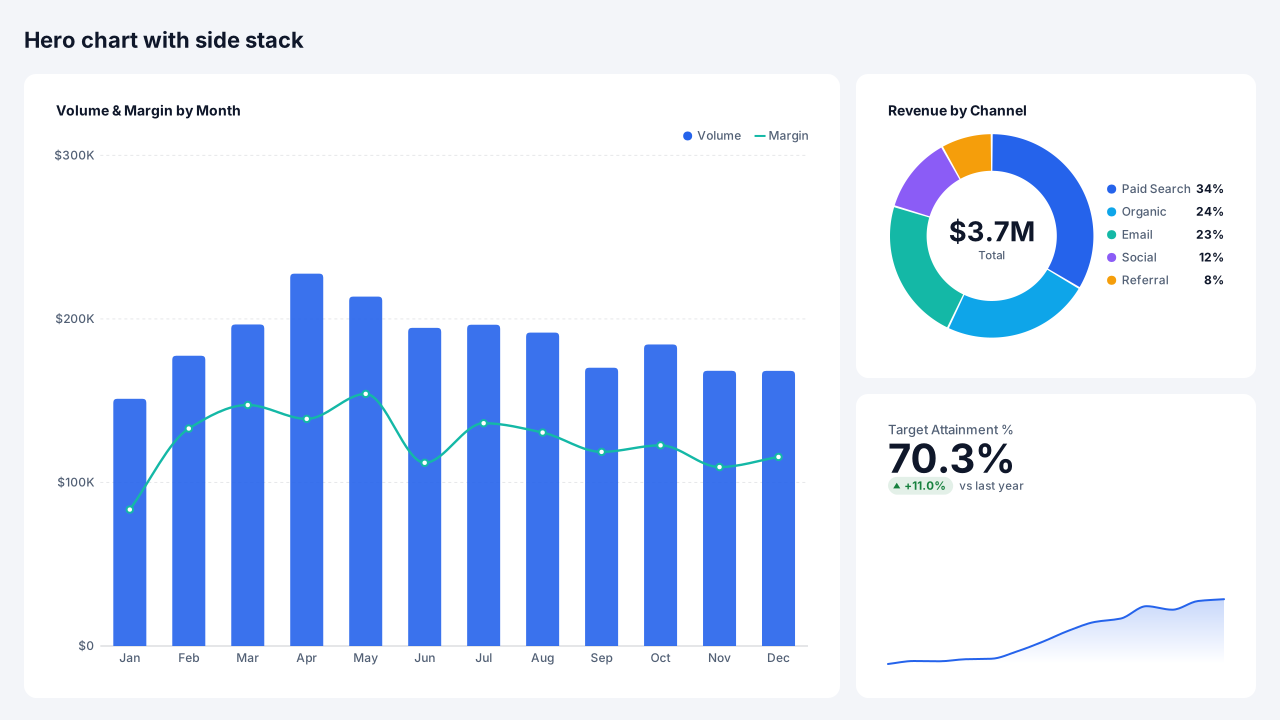
Native Power BI visuals: Line & column chart, Donut chart, Card.
Positions on a 1280 × 720 page
Visual X Y Width Height Volume & Margin by Month (Line & column chart) 40 88 784 592 Revenue by Channel (Donut chart) 872 88 368 272 Target Attainment % (Card) 872 408 368 272 Z-pattern page
KPIs across the top, a wide trend in the middle and a detail table at the bottom, following the Z the eye makes over a page. Puts the numbers to check last.
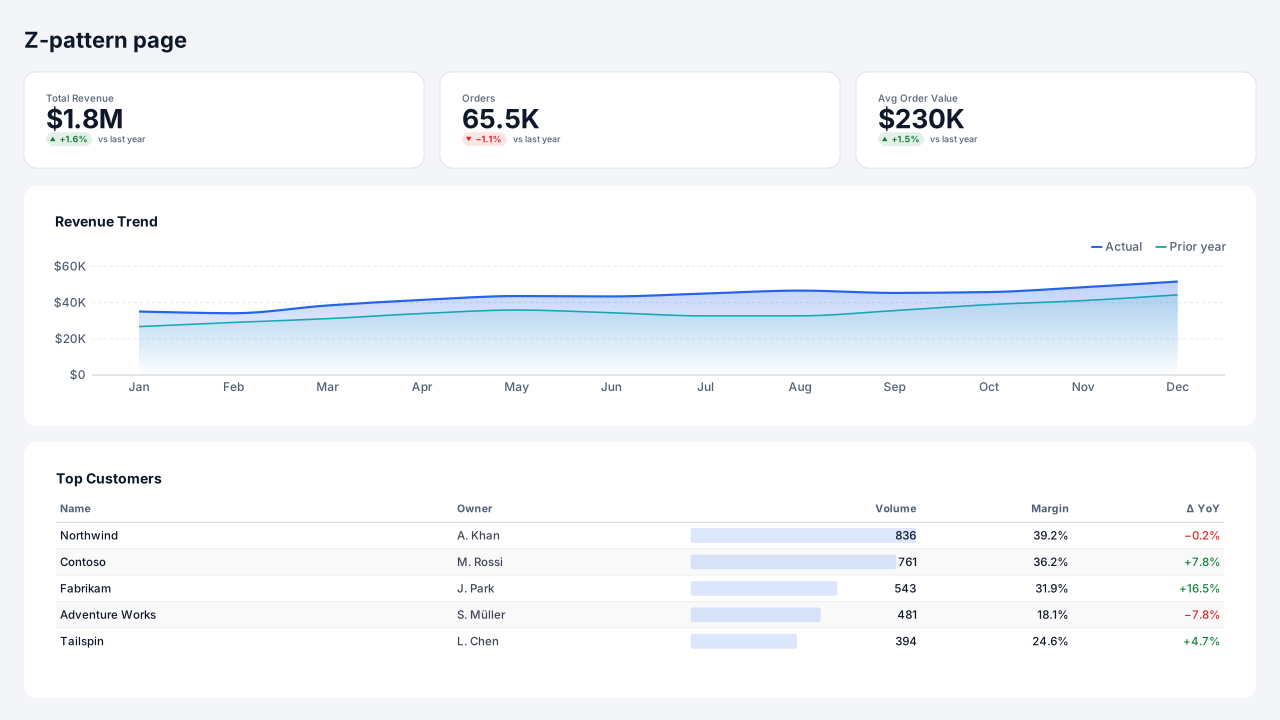
Native Power BI visuals: Card × 3, Area chart, Table.
Positions on a 1280 × 720 page
Visual X Y Width Height Total Revenue (Card) 40 88 368 64 Orders (Card) 456 88 368 64 Avg Order Value (Card) 872 88 368 64 Revenue Trend (Area chart) 40 200 1200 208 Top Customers (Table) 40 456 1200 224 Filter sidebar with 2 × 2 grid
A slicer sidebar on the left and four equal panels in a 2 × 2 grid. Good for comparing four views of the same filtered data.
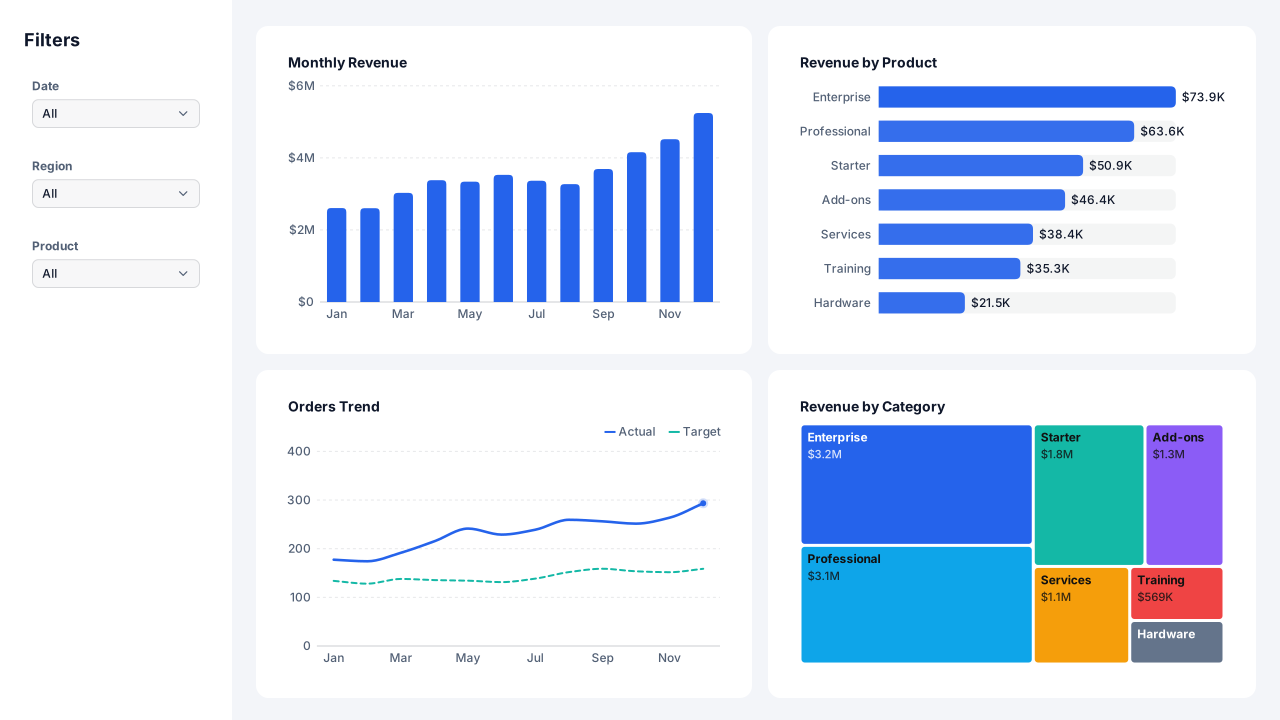
Native Power BI visuals: Slicer (dropdown) × 3, Column chart, Bar chart, Line chart, Treemap.
Positions on a 1280 × 720 page
Visual X Y Width Height Date (Slicer) 24 72 184 64 Region (Slicer) 24 152 184 64 Product (Slicer) 24 232 184 64 Monthly Revenue (Column chart) 272 40 464 296 Revenue by Product (Bar chart) 784 40 456 296 Orders Trend (Line chart) 272 384 464 296 Revenue by Category (Treemap) 784 384 456 296 Three equal columns
Three columns, each a card over a chart, for side-by-side comparisons of three regions, products or periods. Keep the same chart type in every column.
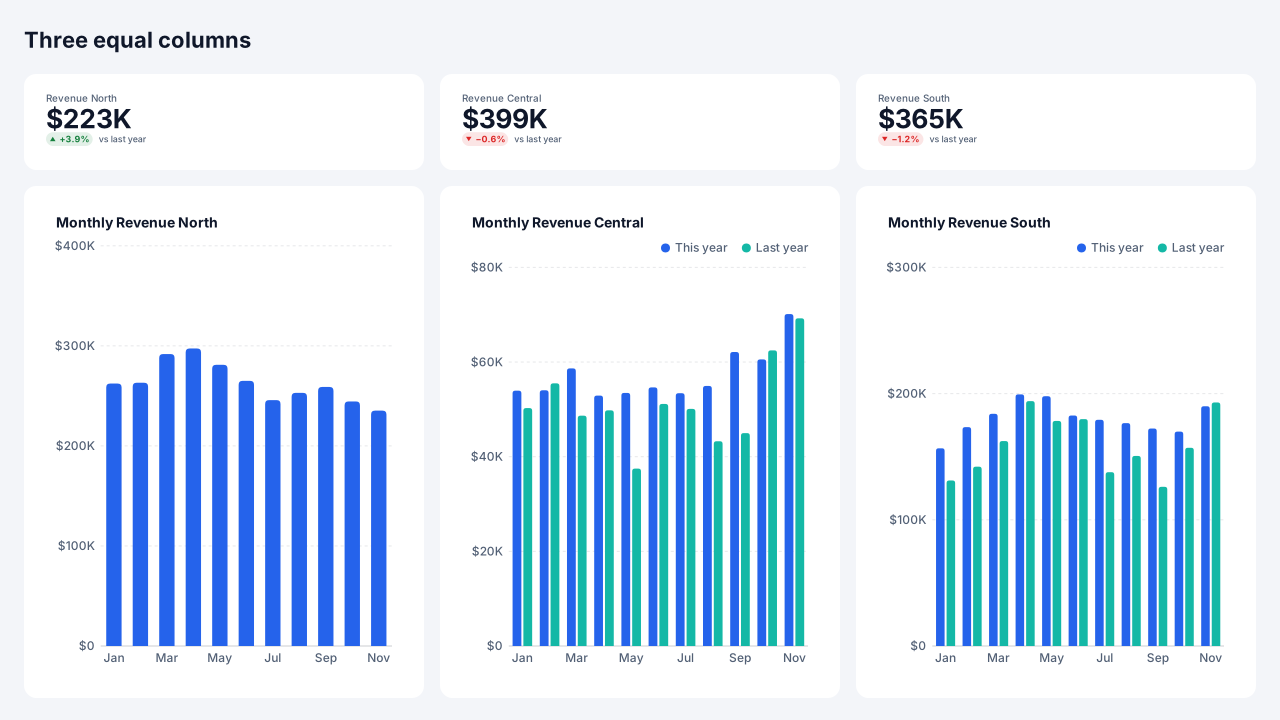
Native Power BI visuals: Card × 3, Column chart × 3.
Positions on a 1280 × 720 page
Visual X Y Width Height Revenue North (Card) 40 88 368 64 Monthly Revenue North (Column chart) 40 200 368 480 Revenue Central (Card) 456 88 368 64 Monthly Revenue Central (Column chart) 456 200 368 480 Revenue South (Card) 872 88 368 64 Monthly Revenue South (Column chart) 872 200 368 480 KPI strip over a matrix
A slim KPI strip and a full-width matrix below it: the layout for finance and operations pages where the table is the content.
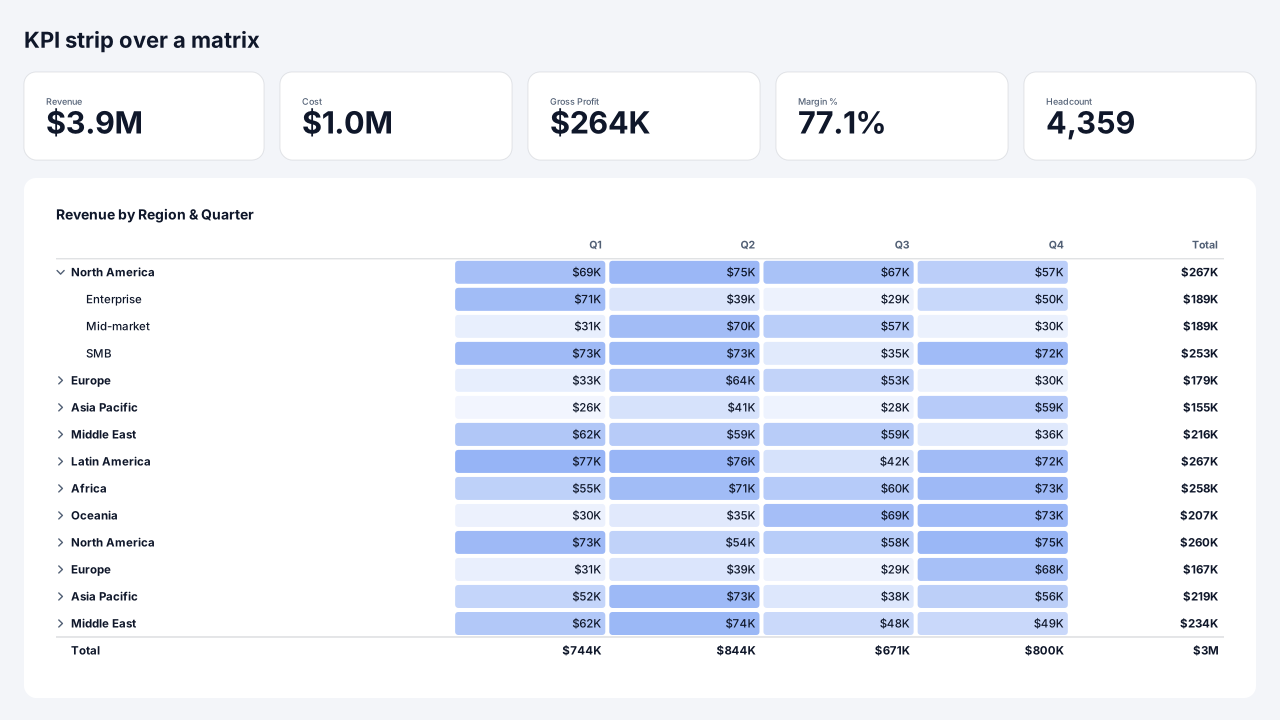
Native Power BI visuals: Card × 5, Matrix.
Positions on a 1280 × 720 page
Visual X Y Width Height Revenue (Card) 40 88 208 56 Cost (Card) 296 88 200 56 Gross Profit (Card) 544 88 200 56 Margin % (Card) 792 88 200 56 Headcount (Card) 1040 88 200 56 Revenue by Region & Quarter (Matrix) 40 192 1200 488 Six small multiples
Two rows of three equal panels for small multiples: the same chart repeated for six categories on one shared scale.
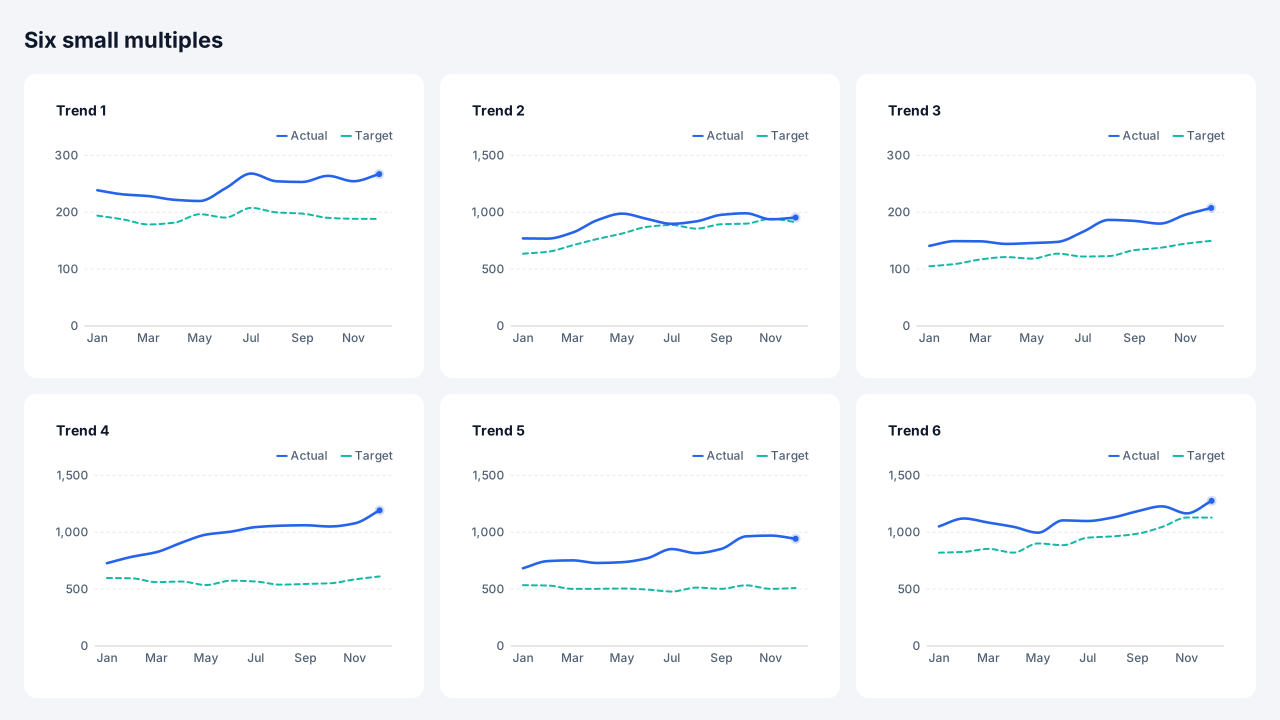
Native Power BI visuals: Line chart × 6.
Positions on a 1280 × 720 page
Visual X Y Width Height Trend 1 (Line chart) 40 88 368 272 Trend 2 (Line chart) 456 88 368 272 Trend 3 (Line chart) 872 88 368 272 Trend 4 (Line chart) 40 408 368 272 Trend 5 (Line chart) 456 408 368 272 Trend 6 (Line chart) 872 408 368 272 Map with detail column
A map on the left and a column of a card, a bar chart and a table on the right that respond to the selected location.
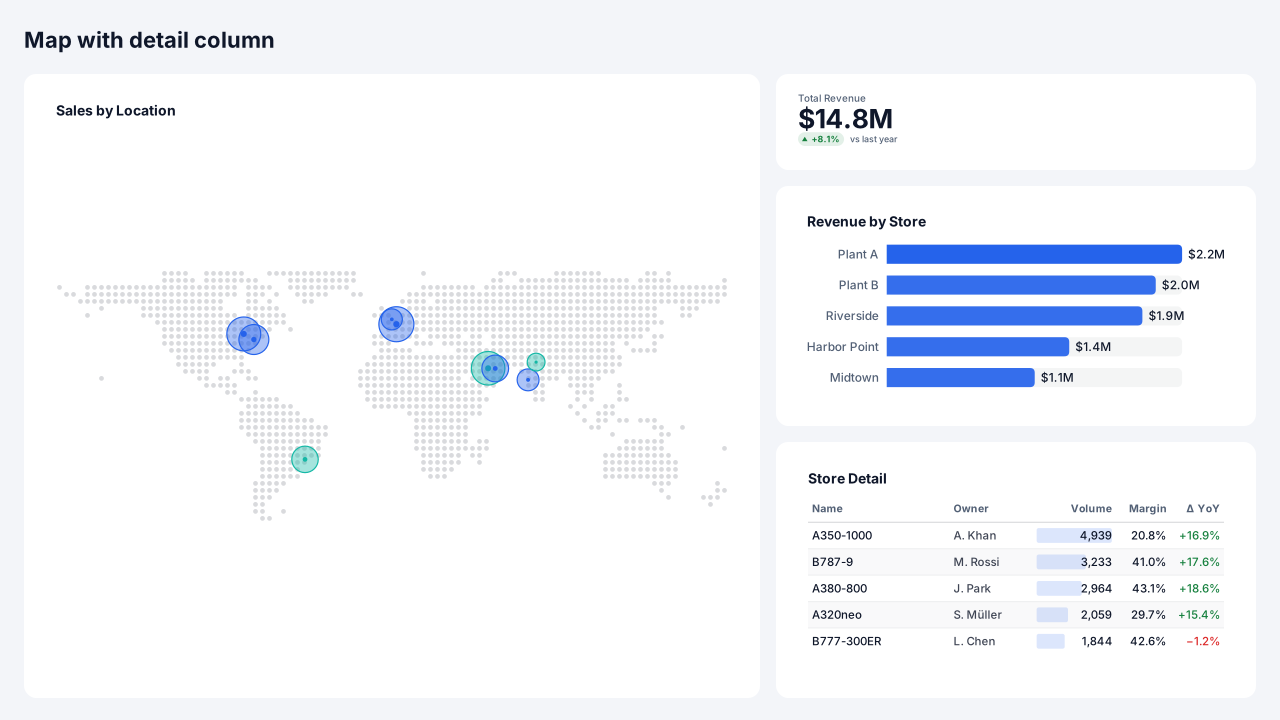
Native Power BI visuals: Map, Card, Bar chart, Table.
Positions on a 1280 × 720 page
Visual X Y Width Height Sales by Location (Map) 40 88 704 592 Total Revenue (Card) 792 88 448 64 Revenue by Store (Bar chart) 792 200 448 208 Store Detail (Table) 792 456 448 224
Design rules for page grids
- Most important, top left
Readers start top left. Put the headline numbers or the main chart there and the detail table last.
- Equal gutters
Use one gutter size everywhere. Uneven gaps read as grouping that isn't meant.
- Fewer, larger visuals
Six to eight visuals per page is plenty; more becomes a wall of tiny charts.
Add a component to your report
- 1
Pick a theme and download
Choose a theme above (or open the component in the Design Studio to use your own brand kit), then download the page folder (.zip).
- 2
Save your report as a .pbip
In Power BI Desktop, File → Save as → Power BI project (.pbip) with the PBIR format, then close Desktop.
- 3
Copy the page folder in
Copy definition/pages/<page> into <YourReport>.Report/definition/pages/, add the page name to pageOrder in pages.json, and register the background PNG in report.json. INSTRUCTIONS.md in the zip has the exact JSON.
- 4
Reopen and connect fields
Reopen the .pbip. The background and every native visual are placed; drag your fields onto slicers and charts, set button actions that need a target (a page or bookmark) and create bookmarks for bookmark navigators.
Frequently asked questions
Are these page grids images or real Power BI visuals?
Both, split the way Power BI works: shapes, text and icons go into the page background image; slicers, page navigators, bookmark navigators, buttons and chart placeholders are real visual containers in the PBIR page folder. 8 of the 8 designs on this page include native visuals.
Do they use my brand colours?
Yes. Every component is drawn from the brand kit's colour roles (page, surface, text, muted, accent, status and data colours) and fonts. Pick a theme here, or open a component in the Design Studio and set your colours, fonts and logo in the Brand panel before exporting.
Can I add one to a page I already designed?
Yes. In the Design Studio, open Insert → Components and click a component: it is drawn in your design's brand and placed where it belongs on the page (a header at the top, a footer at the bottom), scaled to your page size.
Which Power BI Desktop version do I need?
The page folder uses the PBIR report format, the default report format from the September 2026 Power BI Desktop release; older reports can be saved as PBIR with File → Save as → Power BI project. The page-folder export is in beta until we finish checking it in Desktop.