Component library · 8 designs
Power BI slicer design patterns
Where filters sit and which slicer style they use decides whether readers find them. A dropdown takes one line, a list shows every option, tiles suit short ordered values and the Button slicer gives large, touch-friendly chips.
The designs here export Power BI's own slicer visual in the matching mode (dropdown, vertical list or horizontal tiles) or the Button slicer. In “PBIP with sample data” the classic slicers are bound to a field of the sample model; the Button slicer is placed without a field.
By Nawaf Sharaf · Founder & Reliability Engineer · Updated
Free for commercial useLeft filter pane
A card down the left side with four stacked dropdown slicers and a Clear filters button at the bottom. The pattern readers know from web shops: filters on the left, results on the right.
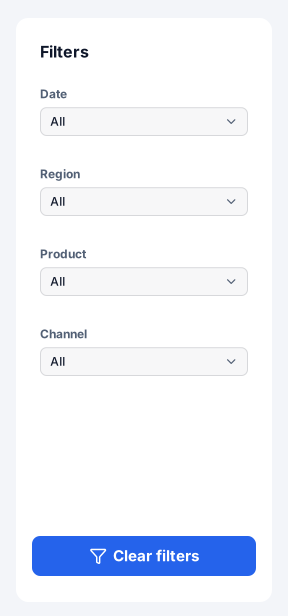
Native Power BI visuals: Slicer (dropdown) × 4, Button.
Positions on a 1280 × 720 page
Visual X Y Width Height Date (Slicer) 40 176 224 64 Region (Slicer) 40 256 224 64 Product (Slicer) 40 336 224 64 Channel (Slicer) 40 416 224 64 Clear filters (Button) 40 632 224 40 Filter bar under the header
Four dropdown slicers in one row under the header, each the same width. Uses 64 px of height for all filters, so the visuals keep the page.

Native Power BI visuals: Slicer (dropdown) × 4.
Positions on a 1280 × 720 page
Visual X Y Width Height Date (Slicer) 24 104 296 64 Region (Slicer) 336 104 296 64 Product (Slicer) 648 104 296 64 Channel (Slicer) 960 104 296 64 Button slicer chips
Power BI's Button slicer as a row of chips for a field with few values (segments, channels). Exported without a field: drag the field onto it in Desktop.

Native Power BI visuals: Button slicer.
Positions on a 1280 × 720 page
Visual X Y Width Height Segment (Slicer) 24 136 720 48 Year tiles
A classic slicer laid out horizontally so each year is a tile. Short ordinal fields (year, quarter, rating) read better as tiles than in a dropdown.
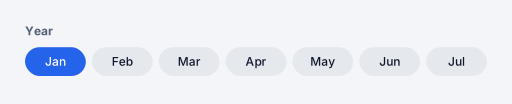
Native Power BI visuals: Slicer (tile).
Positions on a 1280 × 720 page
Visual X Y Width Height Year (Slicer) 24 112 480 72 List slicer in a card
A vertical list slicer with check boxes inside a card, for a field with up to a dozen values where readers want to see every option at once.
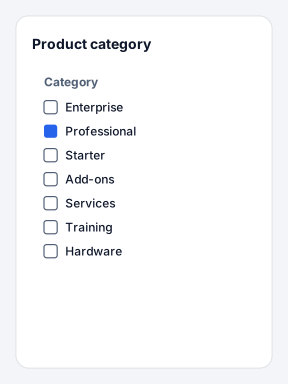
Native Power BI visuals: Slicer (list).
Positions on a 1280 × 720 page
Visual X Y Width Height Category (Slicer) 40 160 224 288 Date range
A date slicer sized for a range: on a calendar date column it exports in Between mode with the two date boxes and the slider. Place it top-right, where people look for the period.
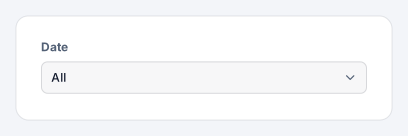
Native Power BI visuals: Slicer (dropdown).
Positions on a 1280 × 720 page
Visual X Y Width Height Date (Slicer) 896 128 344 72 Slicers with apply and clear
Three dropdown slicers and the Apply and Clear buttons in one row. On large models, set the slicers to wait for Apply so each change doesn't requery every visual.

Native Power BI visuals: Slicer (dropdown) × 3, Button × 2.
Positions on a 1280 × 720 page
Visual X Y Width Height Region (Slicer) 24 116 272 64 Product (Slicer) 312 116 272 64 Channel (Slicer) 600 116 264 64 Apply (Button) 896 128 168 40 Clear (Button) 1080 128 168 40 Slicers with scope note
Two slicers under a heading with an info icon and one line that says what they filter. Tells readers which visuals respond, the question filters raise most often.
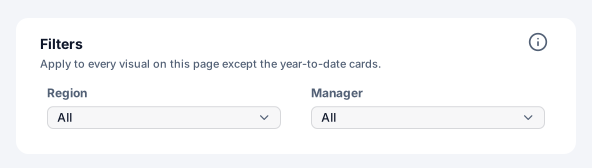
Native Power BI visuals: Slicer (dropdown) × 2.
Positions on a 1280 × 720 page
Visual X Y Width Height Region (Slicer) 48 176 248 56 Manager (Slicer) 312 176 248 56
Design rules for slicer patterns
- Same place on every page
Readers learn where the filters are once. Keep slicers in the same pane or bar across pages and sync them (View → Sync slicers).
- Say what they filter
If a slicer doesn't affect every visual, say so next to it; edit interactions in Desktop to match.
- Apply for heavy models
On a large model, make slicers wait for an Apply click so each change doesn't requery every visual.
Add a component to your report
- 1
Pick a theme and download
Choose a theme above (or open the component in the Design Studio to use your own brand kit), then download the page folder (.zip).
- 2
Save your report as a .pbip
In Power BI Desktop, File → Save as → Power BI project (.pbip) with the PBIR format, then close Desktop.
- 3
Copy the page folder in
Copy definition/pages/<page> into <YourReport>.Report/definition/pages/, add the page name to pageOrder in pages.json, and register the background PNG in report.json. INSTRUCTIONS.md in the zip has the exact JSON.
- 4
Reopen and connect fields
Reopen the .pbip. The background and every native visual are placed; drag your fields onto slicers and charts, set button actions that need a target (a page or bookmark) and create bookmarks for bookmark navigators.
Frequently asked questions
Are these slicer patterns images or real Power BI visuals?
Both, split the way Power BI works: shapes, text and icons go into the page background image; slicers, page navigators, bookmark navigators, buttons and chart placeholders are real visual containers in the PBIR page folder. 8 of the 8 designs on this page include native visuals.
Do they use my brand colours?
Yes. Every component is drawn from the brand kit's colour roles (page, surface, text, muted, accent, status and data colours) and fonts. Pick a theme here, or open a component in the Design Studio and set your colours, fonts and logo in the Brand panel before exporting.
Can I add one to a page I already designed?
Yes. In the Design Studio, open Insert → Components and click a component: it is drawn in your design's brand and placed where it belongs on the page (a header at the top, a footer at the bottom), scaled to your page size.
Which Power BI Desktop version do I need?
The page folder uses the PBIR report format, the default report format from the September 2026 Power BI Desktop release; older reports can be saved as PBIR with File → Save as → Power BI project. The page-folder export is in beta until we finish checking it in Desktop.