Use case · brand refresh
Rebrand an existing Power BI report
For: Analysts and BI developers whose company changed its brand after the reports were built.
A brand refresh lands in the marketing team first. The Power BI reports find out last: dozens of pages still carry the old blue, an old logo pasted as an image, and card colours somebody typed into the format pane two years ago.
Importing a new theme fixes less than people expect, because formatting saved on a visual overrides the theme. Brand Makeover reads your new brand (a PowerPoint template, logo, theme JSON, brand PDF or website), then rewrites the report: a theme in the new colours and fonts, a page background with the new header band and logo, and the per-visual formatting that is safe to change. Queries, measures, filters and bookmarks are hashed before and after, and any difference stops the download.
By Nawaf Sharaf · Founder & Reliability Engineer · Updated
Demo: “Fleet” in the Executive preset
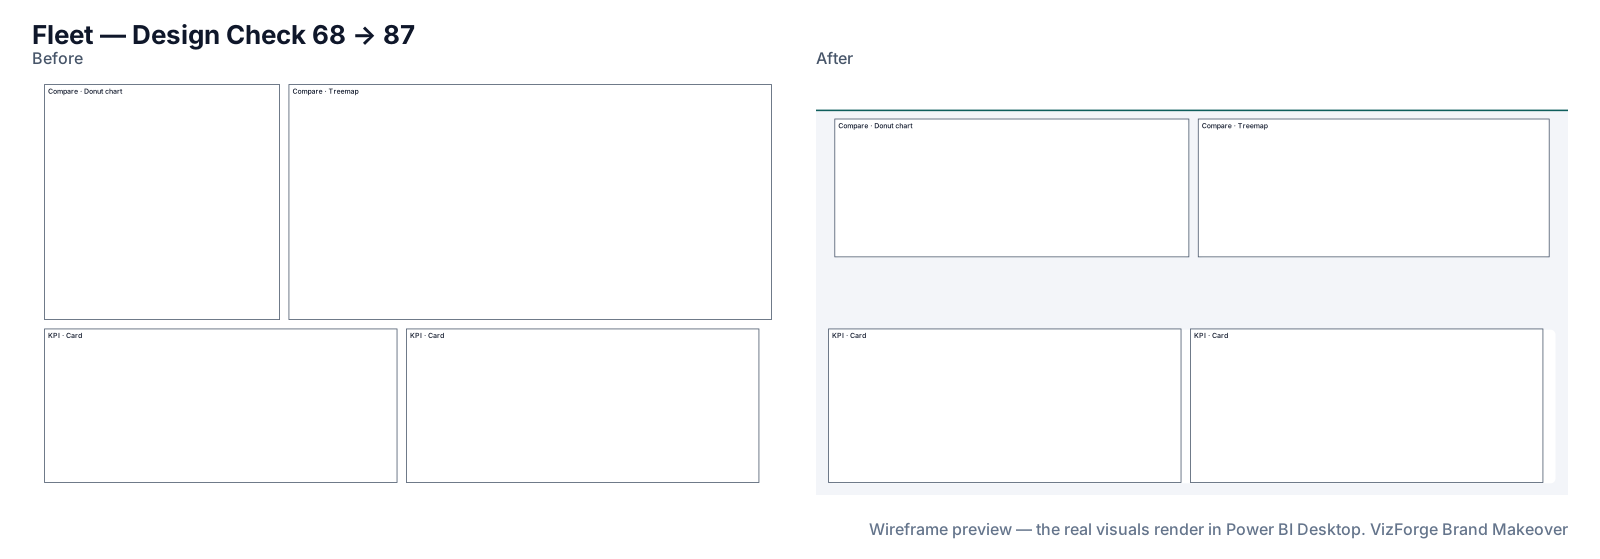
A fictional fleet-operations report on a shared model, built at 1920×1080 with its own blue theme, rebranded to a new fictional kit with the Executive preset. Report and brand are fictional; the run is real: the same engine the tool runs in your browser.
- Report
- Kestrel Fleet Ops (F-PBIR-2), page “Fleet”, 4 visuals
- Brand
- Harbor & Pine (fictional)
- Options
- defaults
- Page size
- 1920×1080 (kept)
- Layout
- brand grid, fits the preset
- Design Check
- 68 → 87 on this page (Design Check 83 → 94, Readability 53 → 80); 74 → 90 across the report
- Changes
- 50 in the change log: 19 backgrounds, 5 layout moves, 1 report settings, 4 tab order, 15 theme, 6 z-order
- Integrity
- ✓ 18 protected files checked unchanged (queries, filters, bookmarks, model)
| Rule | Before | After |
|---|---|---|
| Data colour contrast | — | 4/6 pass |
| Colour-blind-safe neighbours | — | 4/5 pass |
| Smallest text | 0/4 pass | 4/4 pass |
| Title size | 0/4 pass | 4/4 pass |
| Canvas coverage | 0/1 pass | 1/1 pass |
Preset advice on this page
- Pie and donut charts are hard to compare at a glance; a bar chart reads faster.
Download this demo's theme.json (a standard Power BI report theme you can import into any report).
How to do it
- Bring the new brand. Drop the new PowerPoint template, logo, theme JSON or brand PDF, or paste the website. The sources are combined into one kit; each colour shows where it came from.
- Add the report. Zip the folder of the .pbip project (Power BI Desktop → Save as → Power BI project) and drop it. It is read in your browser tab.
- Pick how it should read. Executive, Analyst, Board, Operational or Accessible, or Quick restyle if nothing should move.
- Review and download. Check each page's before/after wireframe and the change list, then download the zip and open it in Desktop.
What the rebrand changes
Only the parts of the project that carry the look:
- The report theme: colours, fonts and text sizes, registered as the report's custom theme (the old custom theme is noted in the change log).
- Page backgrounds: one PNG per page with the header band, your logo and a card behind each visual.
- Safe per-visual formatting: container borders and shadows, button and navigator colours, and, if you tick “Use brand palette”, colours typed straight into visuals.
- Optionally the colours saved in bookmarks, so a clicked bookmark doesn't snap back to the old brand.
Agencies rebranding client reports
A BI consultancy can keep one brand kit per client and run each client's reports through it; nothing about the report leaves the browser, which keeps the conversation with the client's IT team short. The same flow works for a pre-sales demo: restyle your demo report in the prospect's brand before the meeting.
After a merger or acquisition
Integration teams inherit reports in two or three brands. Run each through the surviving brand's kit; the change log in each zip (MAKEOVER.md) lists every colour, move and skipped property, which helps when someone asks what changed.
Group companies with several brands
Signed-in users can save brand kits (colours, fonts and, if they choose, the logo) and delete them at any time. Swapping kits and re-running gives each subsidiary its own version of a shared report, or a seasonal campaign variant, from the same source project.
What never changes
Queries, measures, filters, interactions, drill-through bindings, visual and page names, conditional formatting, custom visuals' own formatting, phone layouts and the semantic model. Each is hashed before and after; any difference stops the download. Your project never leaves the browser tab (the optional paid AI plan sends only a page outline, never data or files). Brand fonts show only where installed.
Questions
Will my data or measures change?
No. Queries, measures, filters, interactions, bookmarks and the semantic model are hashed before and after the makeover; if anything protected differs, the download is stopped and you get the change log instead.
Can we use the theme for embedded, white-label tenants?
The theme.json is a standard Power BI report theme, so it can be applied per report in an embedded setup like any other theme. The makeover itself doesn't touch embedding or tenants.
Our brand font isn't on everyone's machine.
Power BI doesn't embed fonts. When a brand font doesn't ship with Power BI Desktop, the kit uses the closest one that does and says so; brand fonts show only where installed.
Related
Use case · theme troubleshooting
Your Power BI theme isn't applying? Clean up the hard-coded coloursA Power BI theme doesn't override colours typed into a visual. See the visual.json Literal behind it and map those colours to your brand palette, safely.
Preset · Executive
Restyle a Power BI report for executivesTurn an analyst's Power BI report into an executive page: 3–5 KPIs top-left, about six visuals, 18pt titles and 40pt KPI values, in your brand.
Use case · canvas modernisation
Move a 1280×720 Power BI report to 1920×1080Older Power BI reports are often 1280×720. Rescale every page and visual to 1920×1080, re-lay them on a grid and apply a fresh theme, in the browser.
Tool
PowerPoint template to Power BI themeOnly need the theme? theme.json and backgrounds from a .pptx or .potx.