Use case · theme troubleshooting
Your Power BI theme isn't applying? Clean up the hard-coded colours
For: Developers who imported a theme and saw half the report ignore it.
You import a theme and some visuals change while others don't. That isn't a bug: when someone picks a colour in a visual's format pane, Power BI saves it on that visual as a literal value, and a saved value wins over the theme.
Brand Makeover's “Use brand palette” option finds those saved colours in each visual.json and maps every one to the nearest brand colour for its job: text colours to your text colours, backgrounds to your page and card colours, data colours to your data palette. It only touches colours saved without a selector. Per-category colours, colours set by rules or measures (conditional formatting) and custom visuals' own settings are left exactly as they are, and the integrity check proves it.
By Nawaf Sharaf · Founder & Reliability Engineer · Updated
Demo: “Overview” in the Executive preset
A fictional retail report whose cards, bar chart and table headers carry colours typed into the format pane, with “Use brand palette” on. Report and brand are fictional; the run is real: the same engine the tool runs in your browser.
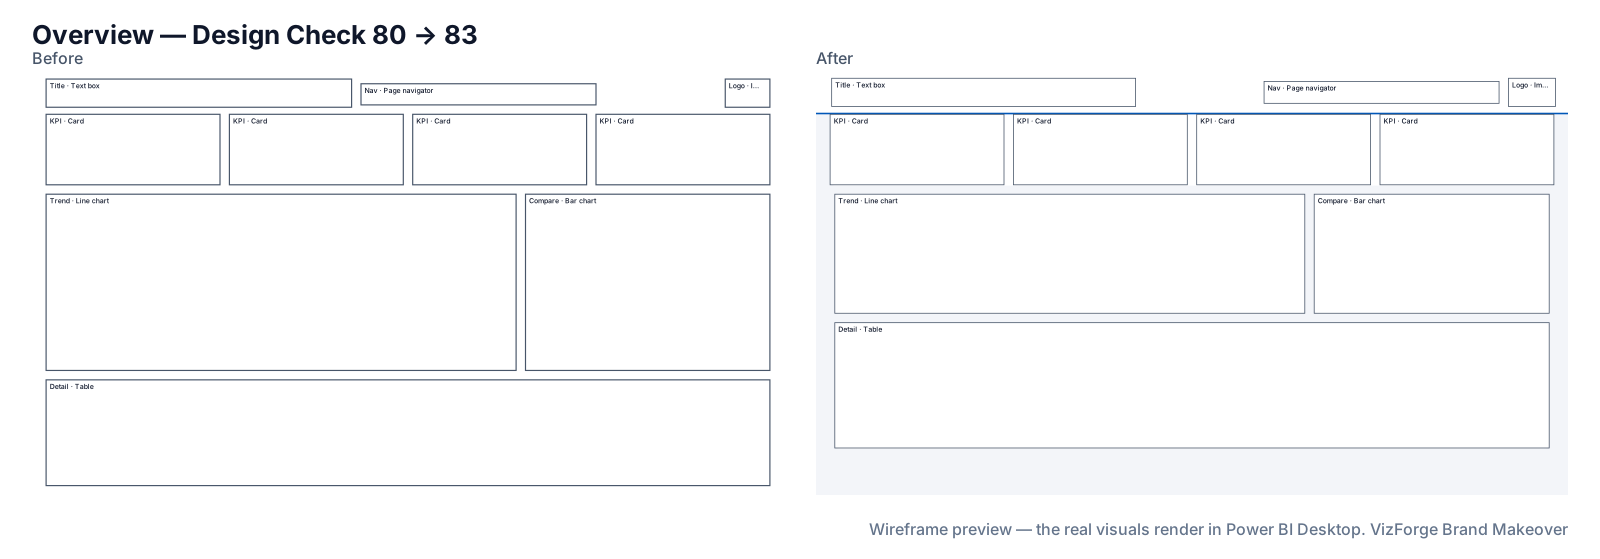
- Report
- Bluefin Outdoor Sales (F-PBIR-1), page “Overview”, 10 visuals
- Brand
- Signal Yard (fictional)
- Options
- use brand palette
- Page size
- 1280×720 → 1920×1080
- Layout
- brand grid, over the preset's budget (flagged)
- Design Check
- 80 → 83 on this page (Design Check 88 → 91, Readability 71 → 74); 85 → 85 across the report
- Changes
- 133 in the change log: 27 backgrounds, 11 formatting, 43 layout moves, 6 page size, 1 report settings, 18 tab order, 19 theme, 8 z-order
- Integrity
- ✓ 51 protected files checked unchanged (queries, filters, bookmarks, model)
| Rule | Before | After |
|---|---|---|
| Colour-blind-safe neighbours | 2/2 pass | 4/5 pass |
| Tab order follows reading order | 0/1 pass | 1/1 pass |
Preset advice on this page
- Executive pages work best without tables; consider moving the table to a drill-through page.
Download this demo's theme.json (a standard Power BI report theme you can import into any report).
The saved colour behind it: card → labels.color
visual.json before
{
  "color": {
    "solid": {
      "color": {
        "expr": {
          "Literal": {
            "Value": "'#0B5563'"
          }
        }
      }
    }
  }
}
visual.json after
{
  "color": {
    "solid": {
      "color": {
        "expr": {
          "Literal": {
            "Value": "'#526075'"
          }
        }
      }
    }
  }
}
How to do it
- Find out why. Open a visual that ignored the theme; if its colours were picked in the format pane, they are saved on the visual.
- Run the makeover with “Use brand palette”. Pick your brand and preset, tick the option under Fine-tune, and review the formatting changes per page.
- Or reset by hand. In Desktop, “Reset to default” on a visual's format pane removes its saved colours one visual at a time.
What is never rewritten
The rewrite is deliberately narrow:
- Colours under a selector (one bar, one category, one series) stay as they are.
- Conditional formatting (rules, gradients, field values) stays as it is.
- Custom visuals are moved but their formatting is their own.
- Theme colour references already follow the new theme and are left alone.
What never changes
Queries, measures, filters, interactions, drill-through bindings, visual and page names, conditional formatting, custom visuals' own formatting, phone layouts and the semantic model. Each is hashed before and after; any difference stops the download. Your project never leaves the browser tab (the optional paid AI plan sends only a page outline, never data or files). Brand fonts show only where installed.
Questions
Does it convert the colours to theme references?
Not yet. Saved colours are rewritten as brand hex values; converting them to theme colour references waits until we've confirmed the format against Power BI Desktop's own files.
Will my bookmarks show the old colours?
Bookmarks can store formatting too. You can opt in to restyling the colours saved in bookmarks; what each bookmark shows and filters stays unchanged.
Related
Use case · brand refresh
Rebrand an existing Power BI reportNew brand, old reports? Apply your new colours, fonts, logo and page backgrounds to an existing Power BI project in the browser, with a change log.
Preset · Executive
Restyle a Power BI report for executivesTurn an analyst's Power BI report into an executive page: 3–5 KPIs top-left, about six visuals, 18pt titles and 40pt KPI values, in your brand.
Use case · dark mode
Make a dark-background version of a Power BI reportBuild a dark-background copy of a Power BI report from your brand: dark page and cards, light text checked at 7:1, data colours kept visible.
Tool
PowerPoint template to Power BI themeOnly need the theme? theme.json and backgrounds from a .pptx or .potx.