Preset · Executive
Restyle a Power BI report for executives
For: Analysts presenting a working report to leadership.
Executives read a page for the answer, not the exploration. The Executive preset re-seats the visuals you already have so that the headline numbers come first: three to five KPI cards across the top-left, charts below, tables flagged for a drill-through page, and type large enough to read across a meeting room.
It moves and restyles; it never swaps a visual for another type. Pie charts, gauges without a target and tables are flagged as advice, so the decision stays with you.
By Nawaf Sharaf · Founder & Reliability Engineer · Updated
Demo: “On-time delivery” in the Executive preset
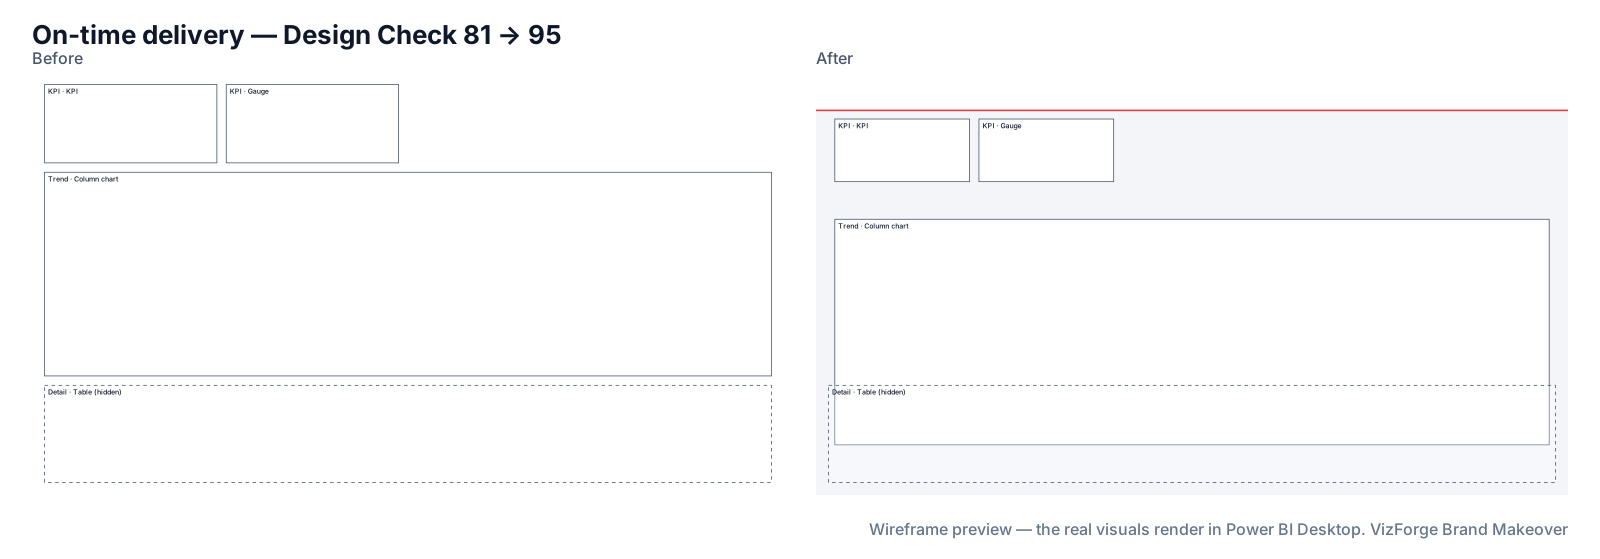
A fictional fleet report's on-time delivery page in the Executive preset with a fictional kit. Report and brand are fictional; the run is real: the same engine the tool runs in your browser.
- Report
- Kestrel Fleet Ops (F-PBIR-2), page “On-time delivery”, 4 visuals
- Brand
- Quarry Ledger (fictional)
- Options
- defaults
- Page size
- 1920×1080 (kept)
- Layout
- brand grid, fits the preset
- Design Check
- 81 → 95 on this page (Design Check 93 → 100, Readability 68 → 90); 74 → 91 across the report
- Changes
- 50 in the change log: 19 backgrounds, 5 layout moves, 1 report settings, 4 tab order, 15 theme, 6 z-order
- Integrity
- ✓ 18 protected files checked unchanged (queries, filters, bookmarks, model)
| Rule | Before | After |
|---|---|---|
| Data colour contrast | — | 4/6 pass |
| Colour-blind-safe neighbours | — | 5/5 pass |
| Smallest text | 0/3 pass | 3/3 pass |
| Title size | 0/3 pass | 3/3 pass |
Download this demo's theme.json (a standard Power BI report theme you can import into any report).
How to do it
- Add brand and report. Any brand source and the project zip.
- Pick Executive. Fine-tune the KPI count, logo side and card style if you like.
- Review the over-budget pages. Pages with more than six visuals get compact spacing where they fit, otherwise they keep their layout (brand and theme only); either way they are flagged with a split suggestion. Pages are never split.
The Executive numbers
12-column grid, 48 px margins, 24 px gutters; a 96 px header bar with the logo on the left and room for two slicers on the right; KPI band 160 px high with 40pt values; at most six visuals including KPIs; visuals cover at most 65% of the page; titles 18pt, labels 14pt. Visual header icons are hidden (a report setting).
“Make it look like the AI dashboards”
When the request from above is “make it look modern”, the quickest win is usually structure, not decoration: fewer visuals, the KPIs first, one title size and a calm background. That is what this preset does. For portfolio pieces, the template gallery has layouts you can restyle a report into.
What never changes
Queries, measures, filters, interactions, drill-through bindings, visual and page names, conditional formatting, custom visuals' own formatting, phone layouts and the semantic model. Each is hashed before and after; any difference stops the download. Your project never leaves the browser tab (the optional paid AI plan sends only a page outline, never data or files). Brand fonts show only where installed.
Questions
Is the “5-second test” measured?
No. It is a rule of thumb the preset is built around, not a score we compute.
Will my KPI cards be resized?
They are moved into the KPI band and sized to it; their data and formatting rules are kept.
Related
Preset · Board / Storytelling
Board pack layout for Power BI reportsRestyle Power BI pages for a board pack: 1–3 hero KPIs, up to four visuals, 24pt titles, print-safe flat cards and a landscape before/after print pack.
Preset · Analyst / Dense
A dense analyst layout for Power BI, with a slicer panelKeep everything on one Power BI page: a 240 px left slicer rail, up to twelve visuals on a 24-column grid, tables at full width and a 12pt text floor.
Use case · brand refresh
Rebrand an existing Power BI reportNew brand, old reports? Apply your new colours, fonts, logo and page backgrounds to an existing Power BI project in the browser, with a change log.
Tool
PowerPoint template to Power BI themeOnly need the theme? theme.json and backgrounds from a .pptx or .potx.