Use case · canvas modernisation
Move a 1280×720 Power BI report to 1920×1080
For: Owners of reports built on the older 1280×720 canvas.
Plenty of production reports were built at 1280×720. On a modern screen they look small and soft, and every attempt to enlarge them means changing the page size, then dragging every visual and re-typing every font size, page by page. Switching to the newer base theme doesn't help on its own: Microsoft Learn notes that existing reports and existing pages don't update their page size; only new pages use the new 1920×1080 default canvas.
Brand Makeover does that move for you. 16:9 pages smaller than 1920×1080 are scaled up with every visual's position and size multiplied by the same factor, and font sizes saved on visuals can be scaled with them. Then each page is re-laid out on a clean grid for the preset you pick, and the theme and backgrounds follow your brand. Pages that aren't 16:9 keep their size and are laid out inside it.
By Nawaf Sharaf · Founder & Reliability Engineer · Updated
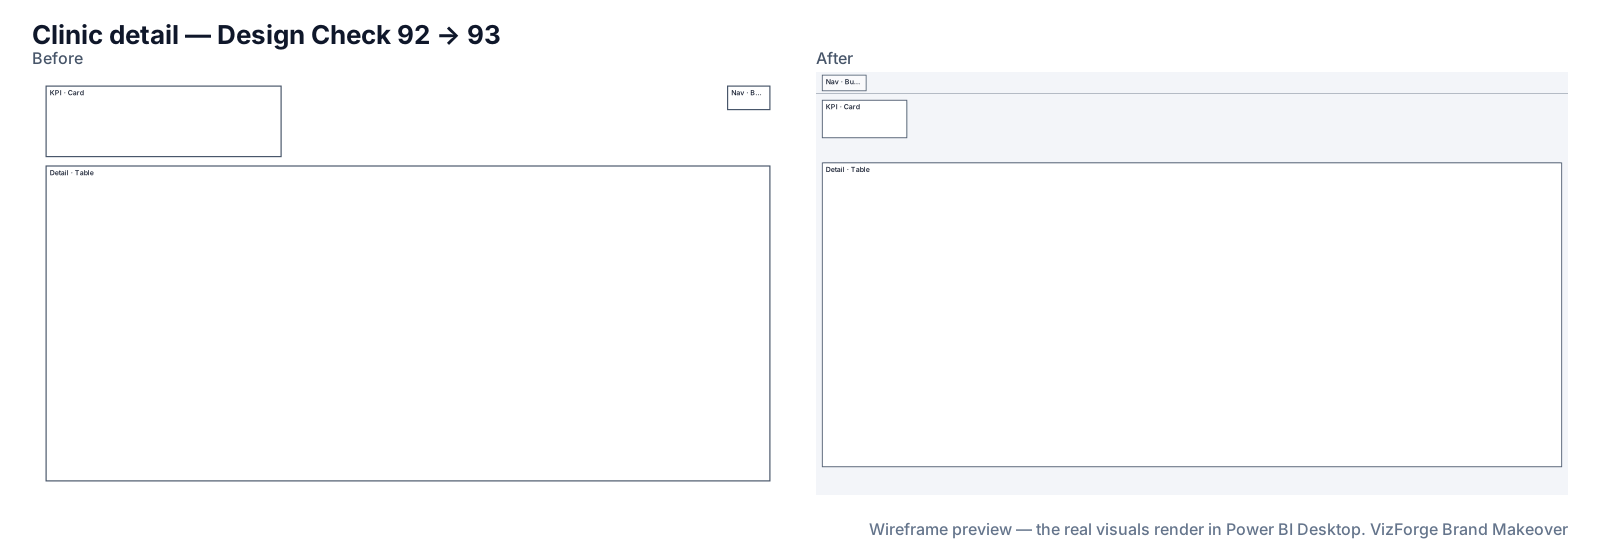
Demo: “Clinic detail” in the Analyst / Dense preset
A fictional clinic-operations report built at 1280×720, moved to 1920×1080 with the Analyst preset and the default kit. Report and brand are fictional; the run is real: the same engine the tool runs in your browser.
- Report
- Maple Row Clinics (F-PBIR-3), page “Clinic detail”, 3 visuals
- Brand
- Corporate Blue
- Options
- defaults
- Page size
- 1280×720 → 1920×1080
- Layout
- brand grid, fits the preset
- Design Check
- 92 → 93 on this page (Design Check 100 → 100, Readability 84 → 86); 92 → 94 across the report
- Changes
- 93 in the change log: 39 backgrounds, 1 formatting, 11 layout moves, 6 page size, 10 tab order, 16 theme, 10 z-order
- Integrity
- ✓ 27 protected files checked unchanged (queries, filters, bookmarks, model)
| Rule | Before | After |
|---|---|---|
| Data colour contrast | 1/2 pass | 5/8 pass |
| Colour-blind-safe neighbours | 1/1 pass | 4/7 pass |
| Tab order follows reading order | 0/1 pass | 1/1 pass |
Download this demo's theme.json (a standard Power BI report theme you can import into any report).
How to do it
- Save the report as a project. In Power BI Desktop: File → Save as → Power BI project (.pbip). Zip the folder.
- Add a brand (or keep the default). The kit can be your template or logo; the default kit is fine if only the size matters.
- Pick a preset. Analyst keeps dense pages dense; Executive gives each page more air. Quick restyle only resizes and re-themes.
- Check the flagged pages. Open the new .pbip in Desktop and look at pages marked ⚠ over budget first.
What is rescaled, and what isn't
Every visual on a 16:9 page is moved and resized by the same factor, then placed on the preset's grid. Groups and hidden visuals are only scaled (group coordinates aren't moved until Power BI's own saved samples confirm how they are stored). Tooltip pages keep their size. Phone layouts are left as they are, so phones keep the old look.
Font sizes
Font sizes saved on visuals are multiplied by the page factor. The preset's own sizes go into the theme. Minimum text sizes are reported as advice, not written, until we've confirmed in Power BI Desktop files how font-size values are stored.
What never changes
Queries, measures, filters, interactions, drill-through bindings, visual and page names, conditional formatting, custom visuals' own formatting, phone layouts and the semantic model. Each is hashed before and after; any difference stops the download. Your project never leaves the browser tab (the optional paid AI plan sends only a page outline, never data or files). Brand fonts show only where installed.
Questions
Does this work on a .pbix?
Not directly: save it as a Power BI project (.pbip) in Desktop first. A .pbix is refused with those steps.
What about pages that are 4:3 or a custom size?
They keep their size; visuals are laid out on the grid inside that page. Catalog templates are only used on 16:9 pages.
Is the before/after picture a render?
No, previews are wireframes: one labelled box per visual over the new background. The real visuals render in Power BI Desktop.
Sources
Related
Use case · brand refresh
Rebrand an existing Power BI reportNew brand, old reports? Apply your new colours, fonts, logo and page backgrounds to an existing Power BI project in the browser, with a change log.
Preset · Analyst / Dense
A dense analyst layout for Power BI, with a slicer panelKeep everything on one Power BI page: a 240 px left slicer rail, up to twelve visuals on a 24-column grid, tables at full width and a 12pt text floor.
Preset · Executive
Restyle a Power BI report for executivesTurn an analyst's Power BI report into an executive page: 3–5 KPIs top-left, about six visuals, 18pt titles and 40pt KPI values, in your brand.
Tool
PowerPoint template to Power BI themeOnly need the theme? theme.json and backgrounds from a .pptx or .potx.