Use case · accessibility
Fix contrast, tab order and colour-only status in a Power BI report
For: Public-sector BI teams and accessibility leads reviewing Power BI reports.
Accessibility reviews of Power BI reports keep finding the same things: grey text that doesn't reach 4.5:1, red and green next to each other in a legend, KPIs whose only status signal is a colour, a tab order nobody set, and visuals with no alt text.
Brand Makeover scores each page against those rules before and after (Readability, beside Design Check) and the Accessible preset fixes what it can safely change: it raises the kit's text colour to 7:1 and data colours to 3:1 against the page and cards (hue kept; if your page and card colours are too far apart for 7:1 on both, it keeps your text colour and says so), renumbers the tab order to follow reading order on the pages it re-lays out, keeps visual header icons for keyboard users, draws 2px borders instead of shadows and keeps a left filter rail. What it can't fix without your judgement, such as alt text or a status shown only by colour, is listed as advice. Alt text is never invented.
By Nawaf Sharaf · Founder & Reliability Engineer · Updated
Demo: “On-time delivery” in the Accessible preset
A fictional fleet report run through the Accessible preset with a colour-blind-safe kit (Okabe–Ito hues) whose mid-grey text the preset raises to 7:1. Report and brand are fictional; the run is real: the same engine the tool runs in your browser.
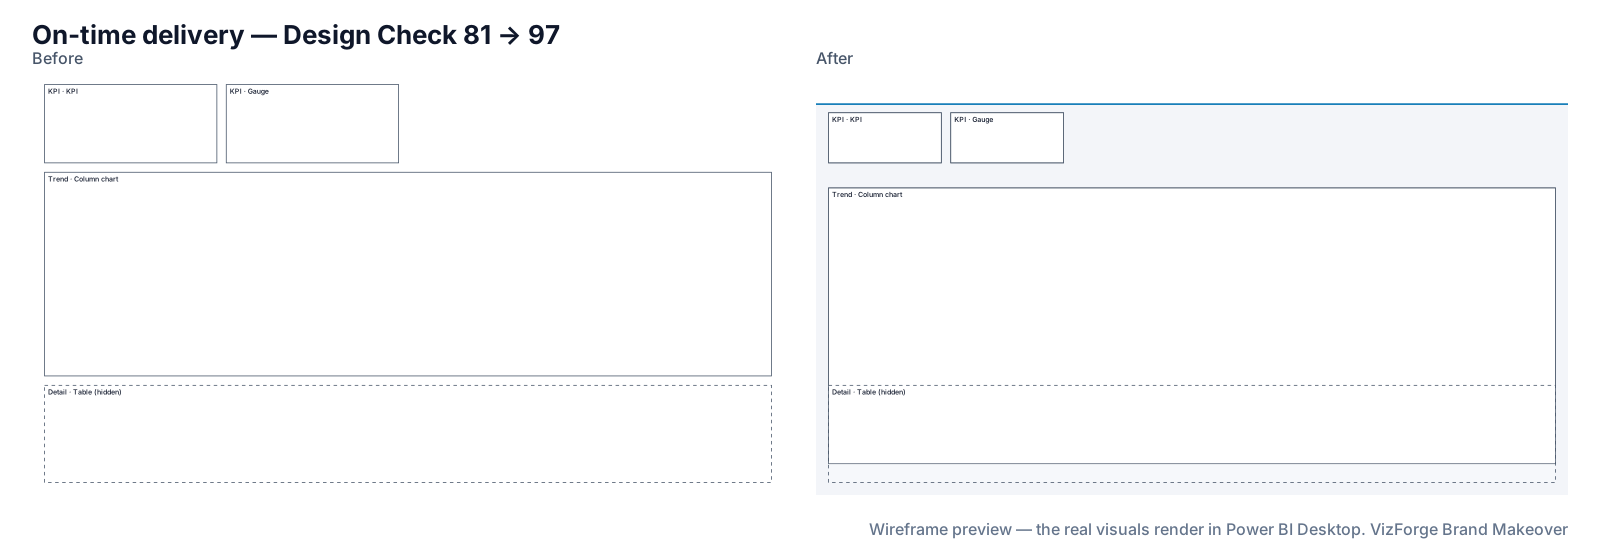
- Report
- Kestrel Fleet Ops (F-PBIR-2), page “On-time delivery”, 4 visuals
- Brand
- Civic Blue (fictional)
- Options
- defaults
- Page size
- 1920×1080 (kept)
- Layout
- brand grid, fits the preset
- Design Check
- 81 → 97 on this page (Design Check 93 → 100, Readability 68 → 93); 75 → 94 across the report
- Changes
- 49 in the change log: 19 backgrounds, 5 layout moves, 4 tab order, 15 theme, 6 z-order
- Integrity
- ✓ 18 protected files checked unchanged (queries, filters, bookmarks, model)
| Rule | Before | After |
|---|---|---|
| Data colour contrast | — | 6/6 pass |
| Colour-blind-safe neighbours | — | 5/5 pass |
| Smallest text | 0/3 pass | 3/3 pass |
| Title size | 0/3 pass | 3/3 pass |
Kit adjusted for the preset: foreground #4B5563 → #4A5462; muted #6B7280 → #69707D; data[1] #C68900 → #BC8200; data[3] #CC79A7 → #C972A2; data[4] #239DE2 → #1D95D9; data[2] #009E73 → #1D95D9; data[4] #1D95D9 → #009E73.
Download this demo's theme.json (a standard Power BI report theme you can import into any report).
How to do it
- Add your brand. Any source works; contrast fixes keep each colour's hue and are listed in the change log.
- Add the report and pick Accessible. The Review screen's Checks tab shows each rule before and after, page by page.
- Work through the advice. Add alt text and status icons where the Checks tab asks; those need a person.
- Download and verify. Open in Desktop and run your usual screen-reader and keyboard pass.
The rules we check
Thresholds are 1920×1080 baselines and scale with the page height. The Accessible preset is stricter than the others for text contrast.
- Text contrast 4.5:1 (7:1 in Accessible, Board and Operational); 3:1 for large text and data colours.
- No neighbouring data colours that colour-vision simulation (protanopia, deuteranopia, tritanopia) shows are hard to tell apart: the kind of pairs Microsoft's accessibility guidance warns about, such as red/green, green/brown and blue/purple.
- Status is not shown by colour alone: a KPI coloured by a rule needs an icon or a label.
- Smallest text, one title size, KPI value size, visuals per page, canvas coverage.
- Tab order follows reading order; buttons are at least 24 px (40 px when icon-only); alt text on every non-decorative visual.
Tab order and keyboard navigation
Power BI moves through visuals in tab order, which reports often leave in creation order. On every page it re-lays out, the makeover renumbers it top-left to bottom-right, header first, and the change log lists every visual's new position in that order. A page that keeps its layout (nothing fit cleanly, or you switched layout off) keeps its original tab order.
What never changes
Queries, measures, filters, interactions, drill-through bindings, visual and page names, conditional formatting, custom visuals' own formatting, phone layouts and the semantic model. Each is hashed before and after; any difference stops the download. Your project never leaves the browser tab (the optional paid AI plan sends only a page outline, never data or files). Brand fonts show only where installed.
Questions
Does this make my report WCAG compliant?
No tool can certify that on its own. The makeover fixes contrast, tab order and layout rules it can measure from the project files, and lists what needs a person (alt text, status icons, data-dependent checks). Your organisation's accessibility review still applies.
Will it write alt text for me?
No. Missing alt text is flagged; we never invent it.
What if I don't want my brand colours changed?
Contrast fixes made while the kit is built are shown on the brand kit, each with an undo (the contrast rule then fails visibly in the Checks tab). The Accessible preset's own 7:1 text adjustment is listed in the change log; to keep your text colour as it is, pick a preset that asks for 4.5:1, such as Executive.
Sources
Related
Use case · dark mode
Make a dark-background version of a Power BI reportBuild a dark-background copy of a Power BI report from your brand: dark page and cards, light text checked at 7:1, data colours kept visible.
Preset · Board / Storytelling
Board pack layout for Power BI reportsRestyle Power BI pages for a board pack: 1–3 hero KPIs, up to four visuals, 24pt titles, print-safe flat cards and a landscape before/after print pack.
Use case · brand refresh
Rebrand an existing Power BI reportNew brand, old reports? Apply your new colours, fonts, logo and page backgrounds to an existing Power BI project in the browser, with a change log.
Tool
PowerPoint template to Power BI themeOnly need the theme? theme.json and backgrounds from a .pptx or .potx.