Preset · Analyst / Dense
A dense analyst layout for Power BI, with a slicer panel
For: Power users who want every number on one screen.
Analysts don't want fewer visuals; they want the ones they have to line up. The Analyst preset keeps dense pages dense: slicers move into a 240 px rail on the left, KPIs sit in a slim band, charts share rows on a 24-column grid and tables take the full width at the bottom.
Slicers that appear on several pages are placed in the same spot on each page, which the Checks tab verifies. When a page still has more than twelve visuals, it is flagged with a split suggestion rather than squeezed below readable sizes.
By Nawaf Sharaf · Founder & Reliability Engineer · Updated
Demo: “Overview” in the Analyst / Dense preset
A fictional retail report's overview page, with its slicers, in the Analyst preset. Report and brand are fictional; the run is real: the same engine the tool runs in your browser.
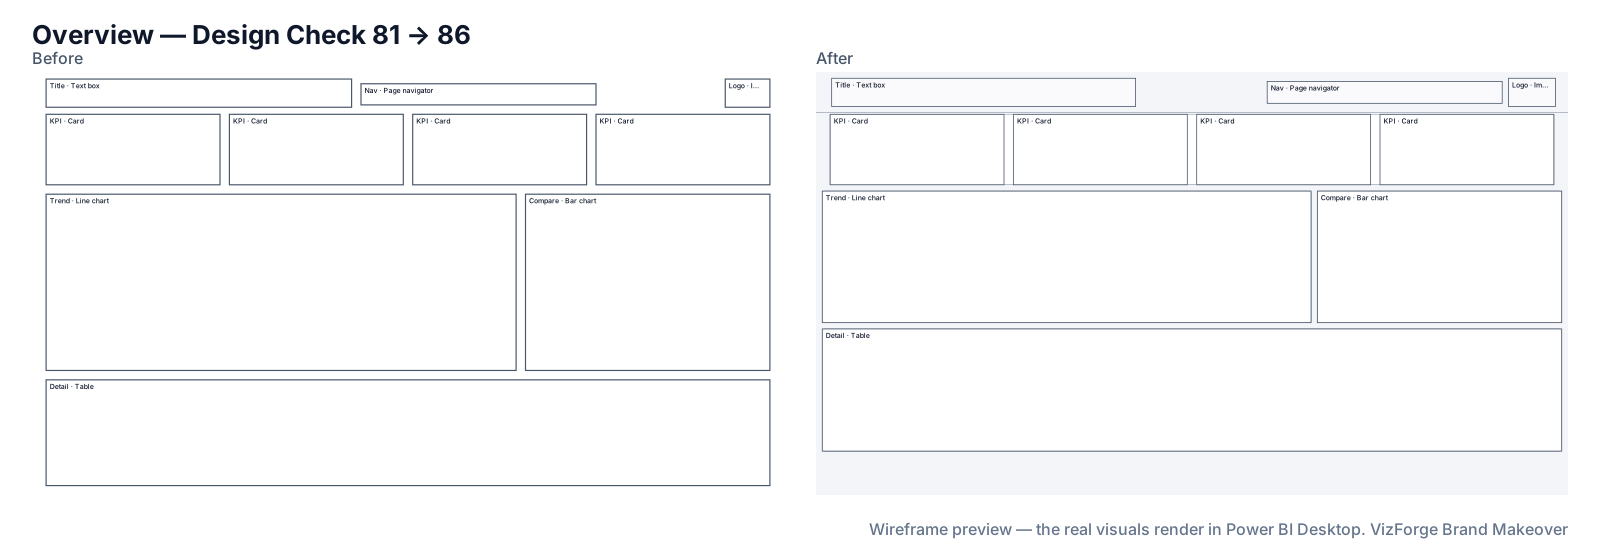
- Report
- Bluefin Outdoor Sales (F-PBIR-1), page “Overview”, 10 visuals
- Brand
- Quarry Ledger (fictional)
- Options
- defaults
- Page size
- 1280×720 → 1920×1080
- Layout
- brand grid, fits the preset
- Design Check
- 81 → 86 on this page (Design Check 88 → 90, Readability 74 → 81); 87 → 88 across the report
- Changes
- 145 in the change log: 27 backgrounds, 6 formatting, 43 layout moves, 6 page size, 22 tab order, 19 theme, 22 z-order
- Integrity
- ✓ 51 protected files checked unchanged (queries, filters, bookmarks, model)
| Rule | Before | After |
|---|---|---|
| One title size | 1/1 pass | 0/1 pass |
| KPIs top-left | 0/1 pass | 1/1 pass |
| Canvas coverage | 0/1 pass | 1/1 pass |
| Tab order follows reading order | 0/1 pass | 1/1 pass |
Download this demo's theme.json (a standard Power BI report theme you can import into any report).
How to do it
- Add brand and report. Any brand source and the project zip.
- Pick Analyst. Turn the filter rail off under Fine-tune if your slicers live in the filter pane.
- Check slicer positions. The Checks tab lists slicers that sit in different places on different pages.
The Analyst numbers
24-column grid, 16 px margins, 12 px gutters; a 56 px minimal header; a 240 px filter rail holding up to six slicers; KPI band 96 px with 24pt values; up to twelve data visuals (KPIs not counted); coverage up to 80%; titles 14pt, labels and the text floor 12pt. Visual header icons stay visible; flat cards with a 4 px radius.
The 12pt floor
Twelve points at 1920×1080 is below the 18pt some practitioners recommend for shared screens; it is the trade-off for density, and the tool says so. Use Executive or Operational for reports read from a distance.
What never changes
Queries, measures, filters, interactions, drill-through bindings, visual and page names, conditional formatting, custom visuals' own formatting, phone layouts and the semantic model. Each is hashed before and after; any difference stops the download. Your project never leaves the browser tab (the optional paid AI plan sends only a page outline, never data or files). Brand fonts show only where installed.
Questions
Does it change my slicers' fields or sync groups?
No. Slicers are only moved; their fields, selections and sync groups are protected and checked unchanged.
Can tables stay where they are?
Switch Layout off for that page on the Review screen: it is then rescaled and restyled but not re-seated.
Related
Preset · Executive
Restyle a Power BI report for executivesTurn an analyst's Power BI report into an executive page: 3–5 KPIs top-left, about six visuals, 18pt titles and 40pt KPI values, in your brand.
Preset · Operational
Power BI layout for wall displays and TV dashboardsReadable from across the room: up to eight KPIs in two big rows with 56pt values, 16pt minimum text, 7:1 contrast and an optional dark background.
Use case · canvas modernisation
Move a 1280×720 Power BI report to 1920×1080Older Power BI reports are often 1280×720. Rescale every page and visual to 1920×1080, re-lay them on a grid and apply a fresh theme, in the browser.
Tool
PowerPoint template to Power BI themeOnly need the theme? theme.json and backgrounds from a .pptx or .potx.