Preset · Operational
Power BI layout for wall displays and TV dashboards
For: Operations and plant managers who put a report on a screen on the wall.
A wall display is read from three metres away by people walking past. The Operational preset spends 40% of the page height on KPIs (up to eight, in two rows, with 56pt values), keeps every other text at 16pt or more and asks for 7:1 text contrast. Bold cards with no shadows keep panels distinct on bright screens.
Nobody uses a slicer on a wall, so slicers are flagged rather than given a rail; tables get advice to keep to about ten rows, since row counts need the data and can't be checked from the files. Tick “Dark background” for screens in dim control rooms.
By Nawaf Sharaf · Founder & Reliability Engineer · Updated
Demo: “Clinics” in the Operational preset
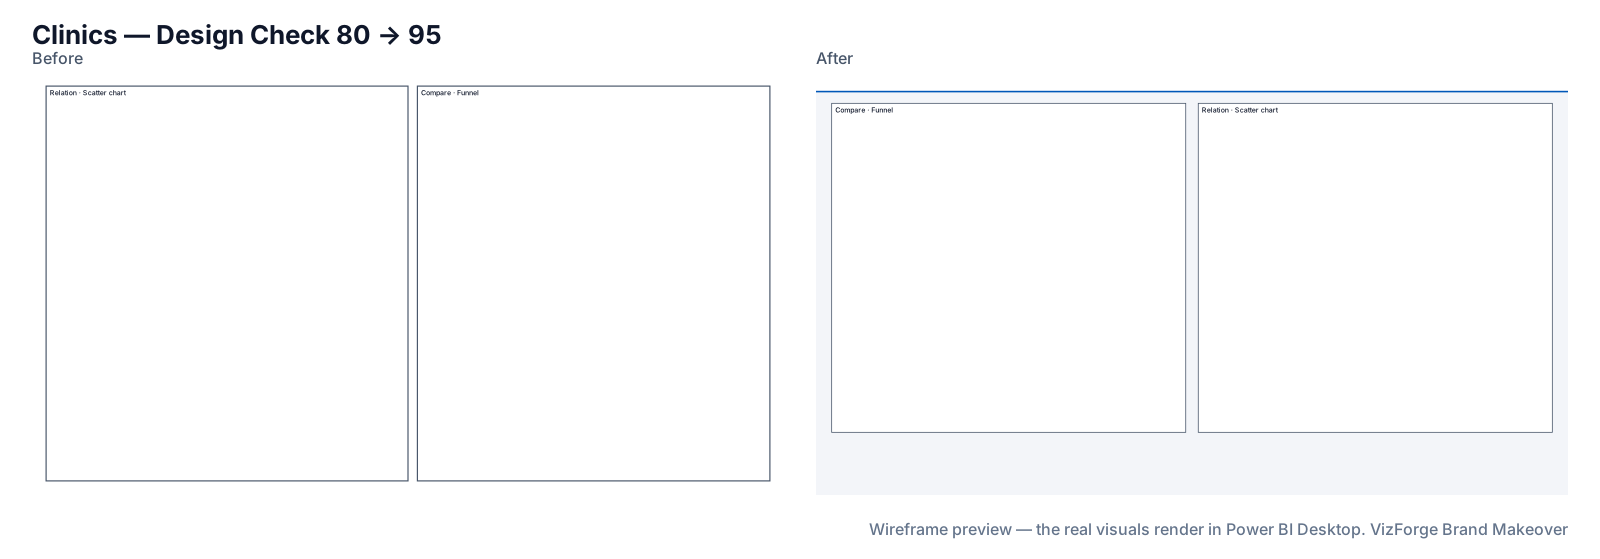
A fictional clinic report's clinics page in the Operational preset with a fictional kit. Report and brand are fictional; the run is real: the same engine the tool runs in your browser.
- Report
- Maple Row Clinics (F-PBIR-3), page “Clinics”, 2 visuals
- Brand
- Signal Yard (fictional)
- Options
- defaults
- Page size
- 1280×720 → 1920×1080
- Layout
- brand grid, fits the preset
- Design Check
- 80 → 95 on this page (Design Check 100 → 100, Readability 59 → 90); 84 → 95 across the report
- Changes
- 94 in the change log: 39 backgrounds, 1 formatting, 11 layout moves, 6 page size, 1 report settings, 10 tab order, 16 theme, 10 z-order
- Integrity
- ✓ 27 protected files checked unchanged (queries, filters, bookmarks, model)
| Rule | Before | After |
|---|---|---|
| Data colour contrast | 1/2 pass | 6/6 pass |
| Colour-blind-safe neighbours | 1/1 pass | 4/5 pass |
| Smallest text | 0/2 pass | 2/2 pass |
| Title size | 0/2 pass | 2/2 pass |
| Canvas coverage | 0/1 pass | 1/1 pass |
Kit adjusted for the preset: data[1] #C68900 → #BC8200; data[2] #00A5A5 → #009D9D.
Download this demo's theme.json (a standard Power BI report theme you can import into any report).
How to do it
- Add brand and report. Any brand source and the project zip.
- Pick Operational. Tick “Dark background” under Fine-tune for dim rooms.
- Read the advice. Slicers and long tables on wall pages are listed in the Checks tab.
The Operational numbers
6-column grid, 40 px margins, 32 px gutters; a 48 px thin header; KPI band 432 px (40% of 1080) in two rows; at most eight visuals; coverage up to 75%; titles 20pt, labels and floor 16pt; text contrast 7:1, large text 4.5:1, graphics 3:1; visual header icons hidden; bold cards.
What never changes
Queries, measures, filters, interactions, drill-through bindings, visual and page names, conditional formatting, custom visuals' own formatting, phone layouts and the semantic model. Each is hashed before and after; any difference stops the download. Your project never leaves the browser tab (the optional paid AI plan sends only a page outline, never data or files). Brand fonts show only where installed.
Questions
Does it set the report to auto-refresh?
No. Refresh and display settings live in the Power BI service and on the display device; the makeover only changes the report's look and layout.
What does the dark background change?
The kit: page and cards in very dark shades of your accent's hue, light text at 7:1, and data colours lightened only as far as needed. Every change is listed in the change log.
Related
Use case · dark mode
Make a dark-background version of a Power BI reportBuild a dark-background copy of a Power BI report from your brand: dark page and cards, light text checked at 7:1, data colours kept visible.
Preset · Analyst / Dense
A dense analyst layout for Power BI, with a slicer panelKeep everything on one Power BI page: a 240 px left slicer rail, up to twelve visuals on a 24-column grid, tables at full width and a 12pt text floor.
Preset · Board / Storytelling
Board pack layout for Power BI reportsRestyle Power BI pages for a board pack: 1–3 hero KPIs, up to four visuals, 24pt titles, print-safe flat cards and a landscape before/after print pack.
Tool
PowerPoint template to Power BI themeOnly need the theme? theme.json and backgrounds from a .pptx or .potx.