Light Power BI theme
Earth Tones Power BI theme
Terracotta, olive, sand and slate Power BI theme on a warm paper page; grounded, low-glare colours for sustainability, agriculture and facilities reports.
By Nawaf Sharaf · Founder & Reliability Engineer · Updated
Free for commercial use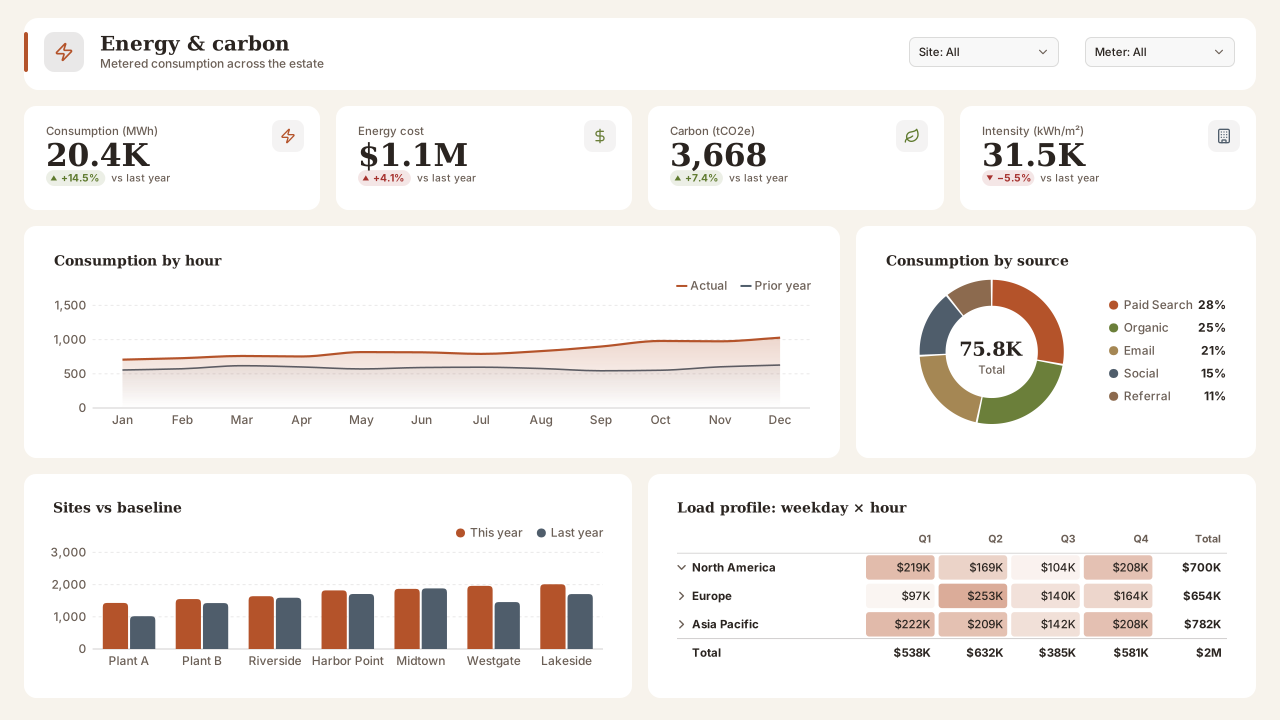
Shown on the Energy Consumption template.
Power BI Desktop: Design ribbon → Import theme. Power BI service: View → Theme pane.
About the palette
Earth Tones trades the usual blue lead for terracotta and builds the rest of the palette from pigments: olive, sand, slate, moss and clay. On the warm paper page (#F7F3EC) the result is low glare and clearly 'not the default theme', which helps a report stand out in a crowded workspace.
It suits sustainability and energy reporting, facilities and estates dashboards, and agriculture or food supply chains. Good is the olive green so favourable results stay in the family.
The sand (#A58754) is the lightest series; it clears 3:1 on white, but keep it for the third series or later and give thin lines a 2px stroke.
Palette profile
Computed from the colours on this page, not written by hand: hue spread, lightness range, contrast and a colour-vision simulation of the first six chart colours.
Best for
- Pages with three or four series: the chart colours come from only 3 hue families, so beyond four categories use a table or small multiples.
- Highlight-one-series charts: #B4532A for the measure you're talking about, 2 near-grey series for comparisons.
- Thin line charts and sparklines on white cards: every chart colour reaches 3.3:1 or more.
Colour-vision simulation
- Protanopia: series 1 and 5 (#B4532A, #8C6A4E); series 2 and 3 (#6B7F3A, #A58754); series 2 and 5 (#6B7F3A, #8C6A4E); series 5 and 6 (#8C6A4E, #2E7A6F)
- Deuteranopia: series 1 and 2 (#B4532A, #6B7F3A); series 1 and 5 (#B4532A, #8C6A4E); series 2 and 5 (#6B7F3A, #8C6A4E)
- Give those series data labels or direct labels instead of relying on the legend.
- Chart colours
- 8, in 3 hue families
- Lightness range
- 33–55 %
- Text contrast
- 13.8:1
- Muted text
- 5.5:1
- Weakest chart colour
- 3.3:1 on cards
- Near-grey series
- 2
- Closest catalog palettes
- Harvest Hope (0.046)Freight Lane (0.055)Paper & Clay (0.057)
Colours and contrast
Contrast ratios are measured against the card (surface) colour, where visuals sit. Text needs 4.5:1; graphics need 3:1.
| Role | Colour | Contrast on card | Check |
|---|---|---|---|
| Page background | #F7F3EC | — | base |
| Card / surface | #FFFFFF | — | base |
| Text | #2A2420 | 15.31:1 | AA text |
| Muted text | #6B5F56 | 6.18:1 | AA text |
| Accent | #B4532A | 4.99:1 | ≥ 3:1 |
| Good | #5F7A2E | 4.87:1 | ≥ 3:1 |
| Neutral | #AE842C | 3.42:1 | ≥ 3:1 |
| Bad | #A6312E | 6.77:1 | ≥ 3:1 |
| Data colour 1 | #B4532A | 4.99:1 | ≥ 3:1 |
| Data colour 2 | #6B7F3A | 4.45:1 | ≥ 3:1 |
| Data colour 3 | #A58754 | 3.39:1 | ≥ 3:1 |
| Data colour 4 | #4F5D6B | 6.75:1 | ≥ 3:1 |
| Data colour 5 | #8C6A4E | 4.90:1 | ≥ 3:1 |
| Data colour 6 | #2E7A6F | 5.09:1 | ≥ 3:1 |
| Data colour 7 | #B57D63 | 3.45:1 | ≥ 3:1 |
| Data colour 8 | #8B8B85 | 3.43:1 | ≥ 3:1 |
Theme JSON excerpt
The downloaded file also includes text classes, visual styles and slicer, table and card defaults.
{
  "name": "Earth Tones",
  "dataColors": [
    "#B4532A",
    "#6B7F3A",
    "#A58754",
    "#4F5D6B",
    "#8C6A4E",
    "#2E7A6F",
    "#B57D63",
    "#8B8B85"
  ],
  "background": "#F7F3EC",
  "foreground": "#2A2420",
  "tableAccent": "#B4532A",
  "good": "#5F7A2E",
  "neutral": "#AE842C",
  "bad": "#A6312E"
}
Import this theme in Power BI Desktop
- 1
Download the theme
Use the Download theme JSON button above. The file is a few kilobytes and contains no images.
- 2
Import the theme
In Power BI Desktop open the Design ribbon → Import theme and select the file. In the Power BI service use View → Theme pane. Older Desktop builds: View → Themes → Browse for themes.
- 3
Check visual overrides
Visuals with manually set colours keep them. Use Format → Reset to default on those visuals to pick up the theme.
- 4
Add a matching background
Open the design studio with Earth Tones selected to build a page background in the same colours.
VizForge AI · custom visuals
Generate a custom visual for this slot
Need a chart Power BI doesn't have? Pick a slot from the sample report above and VizForge AI writes a custom visual (.pbiviz, with TypeScript source) sized to it and drawn in the Earth Tones colours.
Area chart · 784×200 px
1, 2 or 5 credits depending on the brief · 5 free on signup. Sign in or create a free account on the next screen; the brief is saved for 30 minutes.
A Power BI area visual titled "Consumption by hour". It sits in a 784×200 px slot on a designed report page. Match the report's brand: data colours #B4532A, #6B7F3A, #A58754, #4F5D6B, #8C6A4E, #2E7A6F; background #FFFFFF; text #2A2420; font Segoe UI. Transparent visual background so the page design shows through; no visual border. The report uses the Earth Tones Power BI theme.
Templates in this theme
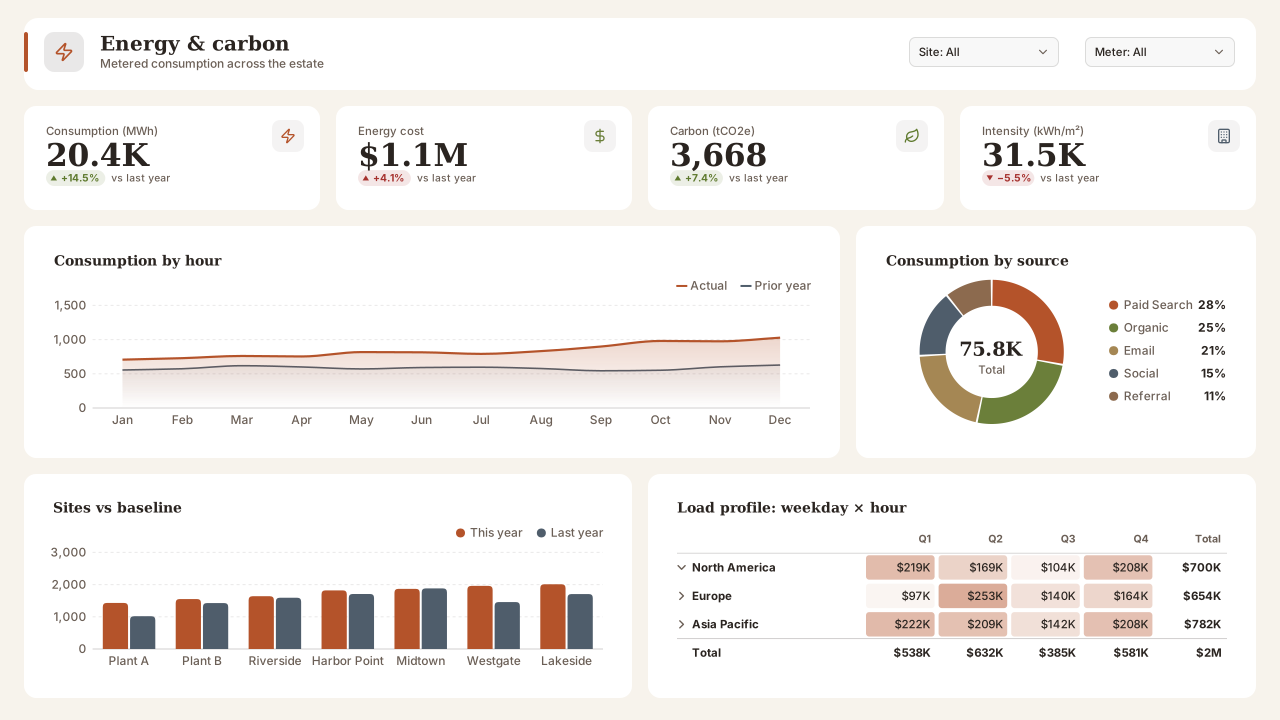
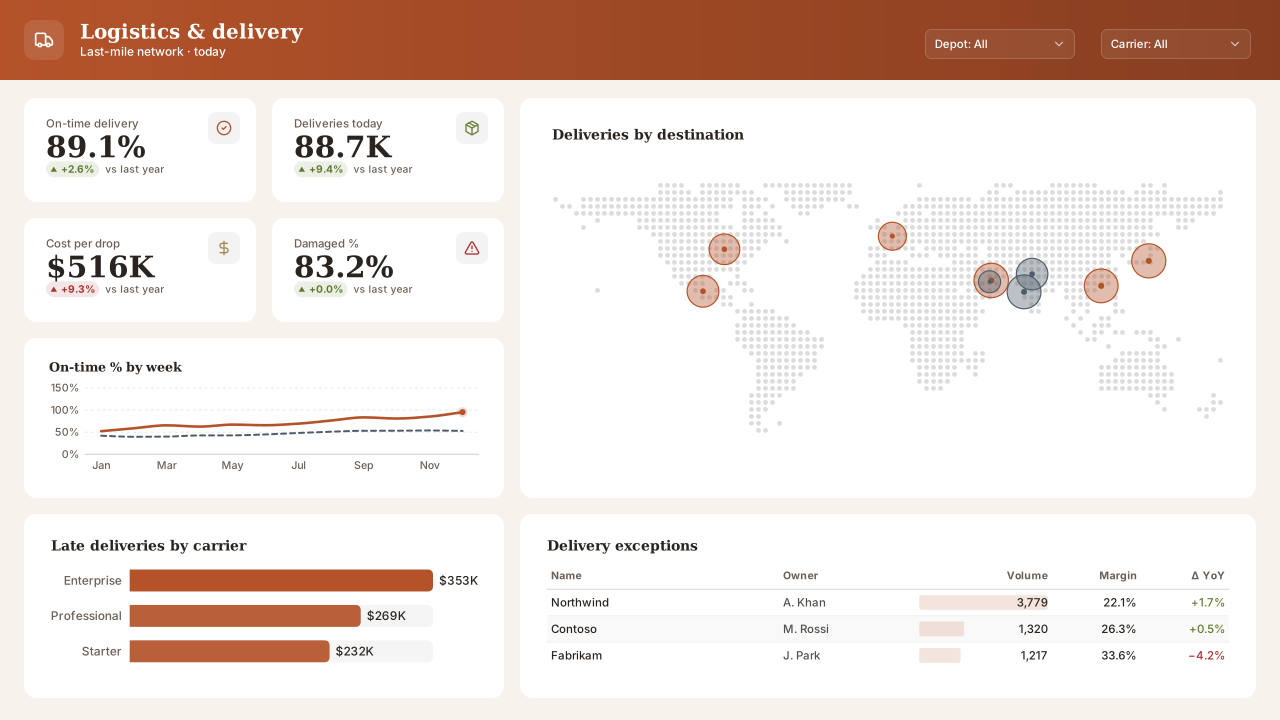
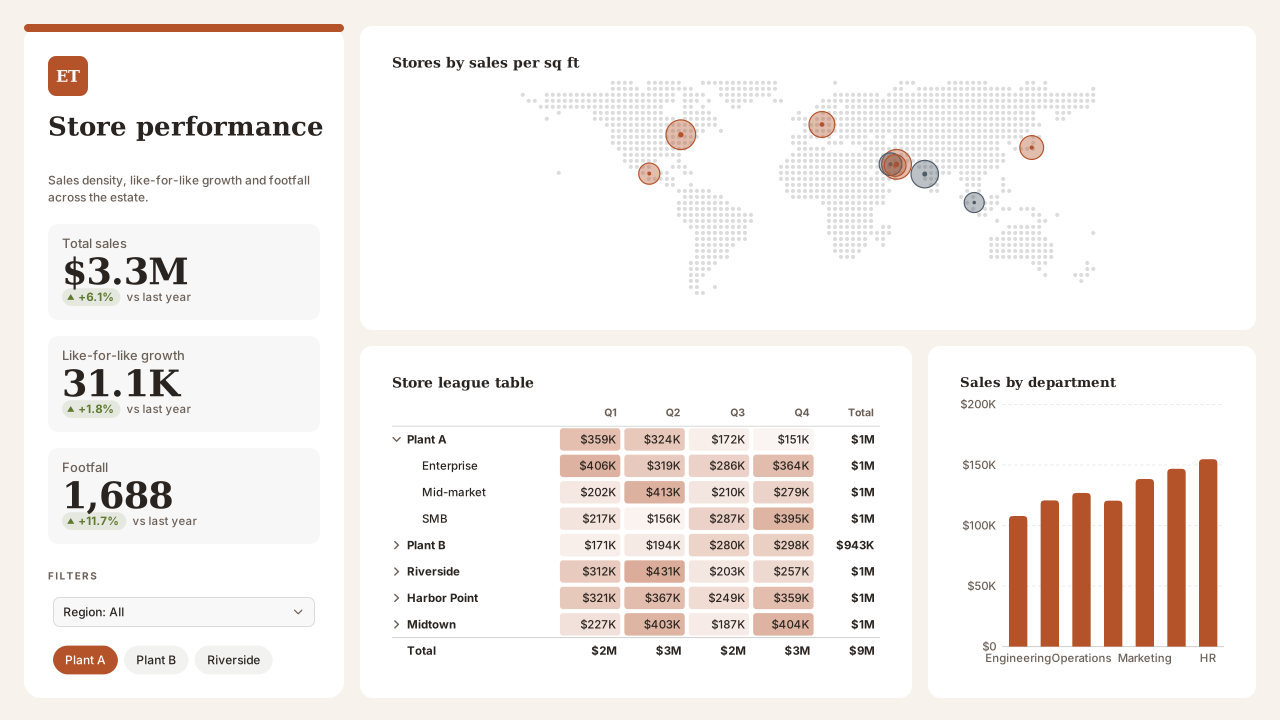
Backgrounds to pair with Earth Tones
Light page backgrounds that sit well under this palette. Each background page has its own theme download, or keep Earth Tones and set the background image on top.
1280×720 background
Nordic Split PanelMinimal light Power BI background with a left story column for title, KPIs and slicers and a large canvas for charts. Calm Nordic palette.
1280×720 background
Ledger Navy FinanceFinance Power BI background with a navy top band, gold rule and flat bordered panels for KPIs, a P&L matrix and two charts. Board-pack style.
Need a chart Power BI doesn’t ship?
Theme colours apply to custom visuals too. Describe the chart in plain English and VizForge generates it as a .pbiviz with its TypeScript source; in the design studio, the brief for a visual slot carries this palette. See the visual catalog.
Generate a custom visual with AI · starts free →Questions about this theme
Is the Earth Tones theme accessible?
Yes. Text and muted text meet WCAG AA (4.5:1) on both the page and card colours, and every data and status colour reaches at least 3:1 against the cards. In a colour-vision simulation 7 pairs among the first six chart colours look alike; the palette profile lists them so you can add data labels. The full contrast table is on this page.
Which fonts does the Earth Tones theme use?
It uses Georgia for headings and Segoe UI for body text. All of them are in Power BI's own font list, so the report renders the same in Power BI Desktop and in the Power BI service.
How do I import a theme JSON into Power BI?
In Power BI Desktop go to the Design ribbon → Import theme and select the downloaded .json file; in the Power BI service use View → Theme pane (older Desktop builds: View → Themes → Browse for themes). The data colours, text classes and visual defaults apply to every page of the report.
Which theme JSON schema do these themes use?
They are compiled against the current report theme schema (reportThemeSchema-2.159) and include name, dataColors, background, foreground, tableAccent, good/neutral/bad, textClasses and visualStyles.
Similar themes
- Forest Night
Dark theme
- Olive Grove
Light theme
- Solar Field
Light theme
- Harvest Hope
Light theme
- Paper & Clay
Light theme
- Terracotta Sun
Light theme
Keep exploring
80 contrast-checked theme JSON files, light and dark.
Build a theme JSON from your own brand colours.
61 hand-designed Power BI page layouts by department.
Page backgrounds at 1280×720 and 1920×1080 with visual positions.
Design a page in Earth Tones
Start the design studio with this palette, lay out your page and export a background, the theme JSON and a PBIP project that all match.
The design studio for Power BI. Free, in your browser, no sign-up.