Free · no signup · runs in your browser
Design a branded Power BI report page
Lay out the page at Power BI’s exact pixel size, then download the background PNG, theme JSON or a PBIP project.
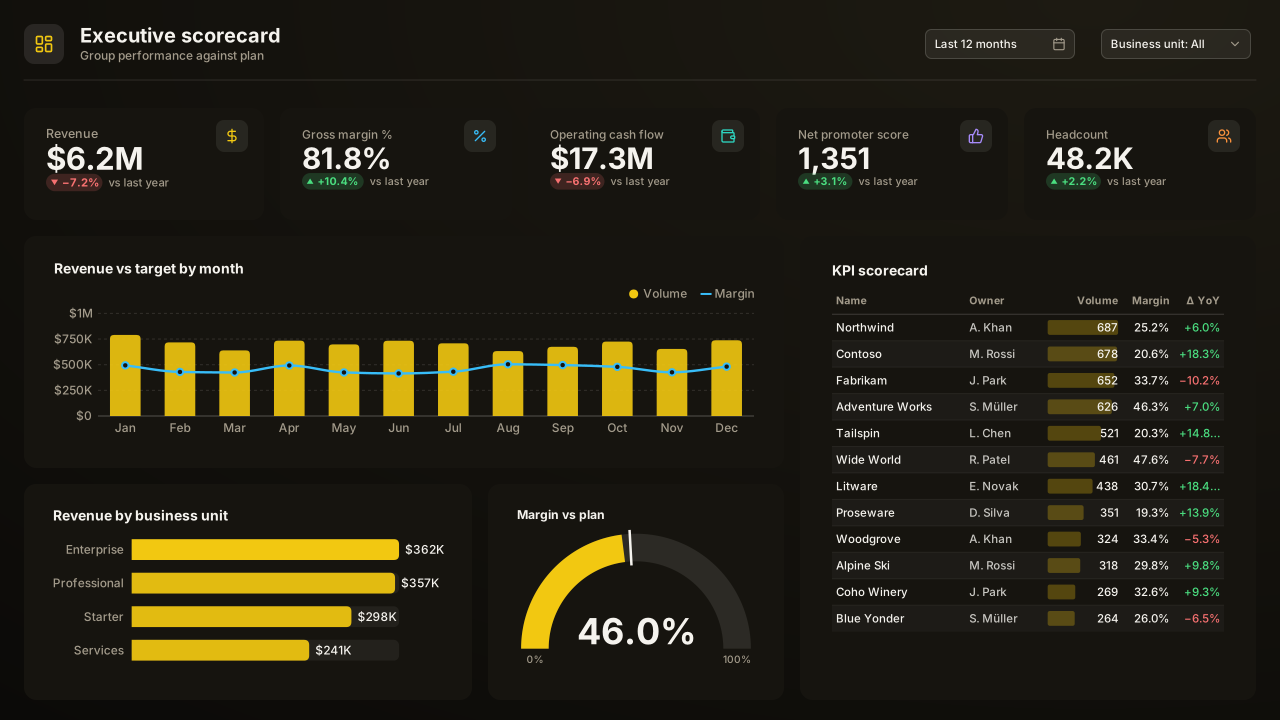
The editor works on a phone; a laptop or desktop gives you more room. Designs save in this browser.
Free · no signup · runs in your browser
The design studio for Power BI
Copilot in Power BI can’t restyle a report, so most dashboards ship with the default look. The VizForge Design Studio lets you lay out a branded report page at Power BI’s exact pixel size, then take it into Power BI Desktop as a background image, a theme or a ready-to-open PBIP project.
Short answer
How do I make a Power BI report look professional without design skills?
Start from a designed page instead of a blank canvas. In this free design studio you pick a template or enter your brand colours, lay out the header, KPI cards and chart slots at Power BI's exact page size, then export a background PNG, a theme JSON and a PBIP project. No signup is needed.
- 01
Design the page
Start from a template, the quick-start layout or a blank canvas: 1920×1080, the default for new pages in a Fluent 2 report, or 1280×720 for Classic reports. Add header bars, card panels, icons, your logo and visual slots where the charts will go. Snapping keeps everything on an 8 px grid.
- 02
Export for Power BI
Download the background as a PNG (2× recommended) or SVG, a theme JSON with your colours and fonts, or a complete PBIP project. Visual slots are left out of the background so real visuals sit on top.
- 03
Apply it in Desktop
Set the PNG in Format page → Canvas background with Image fit set to Fill and 0% transparency, import the theme via the Design ribbon → Import theme (View → Theme pane in the Power BI service), or open the .pbip file directly.
Questions
- What size should a Power BI background image be?
- Match the page size in Format page → Canvas settings. New pages in a Fluent 2 report default to 1920×1080; Classic and older reports use 1280×720. Both are 16:9. Export at the page size, or at 2× for sharper text, then use Image fit: Fill.
- Does my design leave my browser?
- Not unless you share it. Designs, uploaded images and logos stay in your browser’s storage, and exports are built in the browser. A share link carries the design inside the URL itself (large images are left out); when someone opens it, the page is rendered from the link and nothing is stored. The exception is a review link, which you create when signed in: it stores a snapshot of the design so reviewers can pin comments to it, until you delete it.
- Do I need Power BI Desktop to design?
- No. The studio runs in the browser on Windows, Mac or Linux. You need Power BI Desktop (Windows) only to open the PBIP or to import the background and theme into a report; a theme can also be applied in the Power BI service from the Theme pane.
- Are the exported charts native Power BI visuals?
- Yes. Every visual slot becomes a built-in Power BI visual container (card, column, line, table, matrix, slicer and so on) at the slot’s exact position. A slot marked Custom becomes a labelled text box placeholder for a custom visual.
- Can I use designs in client and commercial reports?
- The licence page sets out the terms for templates, themes, backgrounds and studio exports. AI-generated custom visuals are assigned to you by the Terms of Service, commercial use included.
- What costs credits?
- Nothing in the studio. Designing, every export and the galleries are free. Credits are spent only on AI runs: 1, 2 or 5 credits per chart visual (set by the brief's complexity), a flat 15 credits per Synoptic Studio map, and 1 credit per AI SVG measure or Deneb spec run.
- What does the PBIP export contain?
- A Power BI project folder (.pbip, .Report and .SemanticModel) in the PBIR format, with your background image, your theme and an empty visual container at the position and size of every visual slot.
- Is it free?
- Yes. The studio is free with no signup. Free exports carry a small “Made with VizForge” mark; a free account removes it.
Start from something
- Power BI dashboard templatesReport layouts by department, ready to open in the studio.
- Power BI themesAccessible colour palettes with theme JSON downloads.
- Power BI background imagesPage backgrounds for 1280×720 and 1920×1080 pages.
- Power BI iconsSVG and PNG icons for cards, buttons and DAX measures.
- Theme LabFine-tune every field of a Power BI theme JSON.
- AI custom visualsGenerate a .pbiviz for any visual slot from a plain-English brief.
- All toolsThe free studio, galleries, Theme Lab, .pbiviz Inspector and checkers, plus the 1-credit AI tools, in one place.
Drag to compare
The same eleven visuals, before and after
Same chart types, titles, sizes and positions on both sides. Only the page design changes: a background image, panel cards, a header and a theme JSON, which is everything the Design Studio exports.
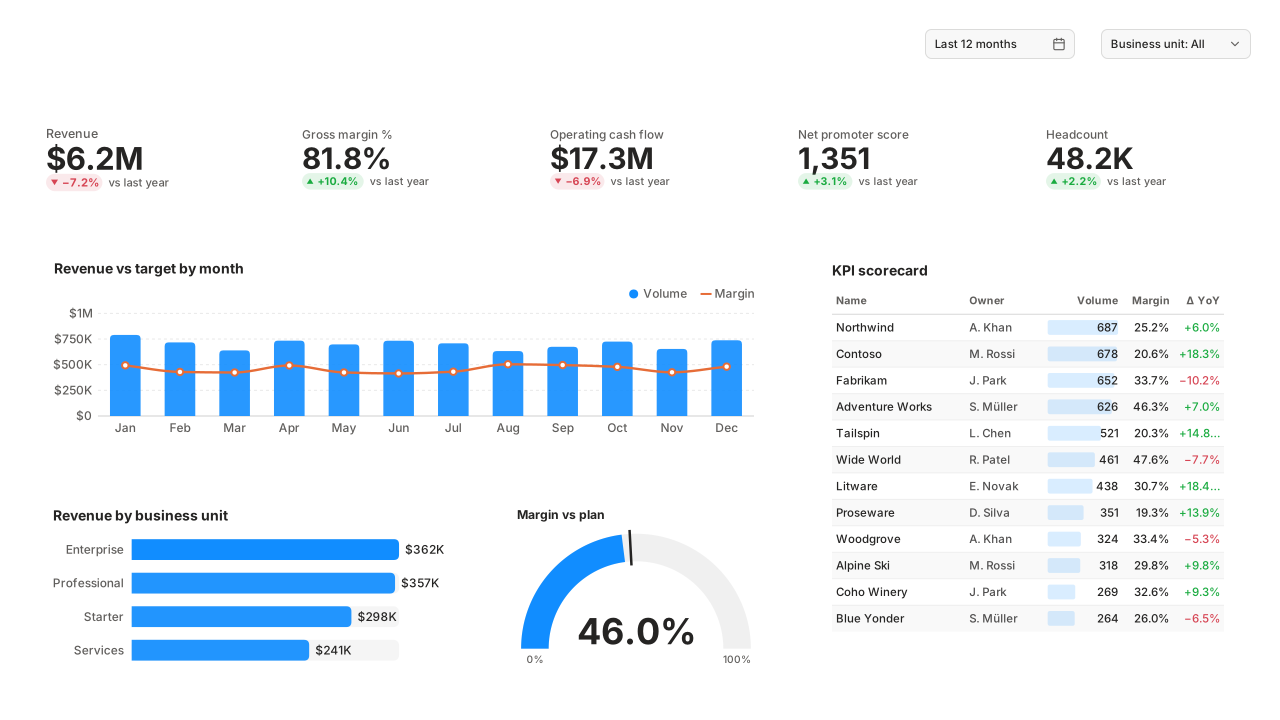
Both halves are drawn by the studio's renderer from the Executive KPI Scorecard template. The “no design” half uses the colours of Power BI's base theme file (CY24SU10) on a white page. New reports in current Power BI Desktop start on the Fluent 2 theme with grey page shades instead. Chart values are sample previews.
Generated from the export code
What's in the PBIP
This is the file list of the Executive KPI Scorecard template's PBIP download, produced by the same export function the download button runs, at the time this page was built.
- files
- 32
- visual containers (11 bound)
- 11
- sample tables
- 4
- DAX measures
- 9
Open the .pbip in Power BI Desktop: the page has the background and theme registered, every visual sits at its slot's X, Y, width and height, and the built-in visuals are bound to the sample model so they show data straight away.
- Executive KPI Scorecard/
- Executive KPI Scorecard.Report/
- definition/
- pages/
- 4b97402a4c9741bd4997/
- visuals/# 11 visual containers
- 01051f68020520fb0305/
- visual.json
- … 10 more visual folders# one per visual slot
- 01051f68020520fb0305/
- page.json# page size + registered background
- visuals/# 11 visual containers
- pages.json
- 4b97402a4c9741bd4997/
- report.json
- version.json
- pages/
- StaticResources/
- RegisteredResources/
- ExecutiveKPIScorecardBackground343590612.png# your page background
- ExecutiveKPIScorecardTheme343590612.json# your theme
- SharedResources/
- BaseThemes/
- CY24SU10.json
- BaseThemes/
- RegisteredResources/
- .platform
- definition.pbir
- definition/
- Executive KPI Scorecard.SemanticModel/
- definition/
- tables/# 4 tables
- Business Unit.tmdl
- Calendar.tmdl
- … 2 more .tmdl tables
- database.tmdl
- model.tmdl
- relationships.tmdl
- tables/# 4 tables
- .platform
- definition.pbism
- definition/
- .gitignore
- Executive KPI Scorecard.pbip# open this in Power BI Desktop
- README.md# what's inside, which slots are bound
- Executive KPI Scorecard.Report/
Where your design data goes
Saved in your browser
Designs autosave to this browser's local storage under My designs. There is no account to create and no copy on our servers.
Exports built on your device
The PNG, SVG, theme JSON and PBIP zip are generated by JavaScript in your browser and downloaded directly.
Share links carry the design
A share link holds the whole design inside the URL (large embedded images are left out). We render the preview from the link when it's opened and don't store it. Only an optional review link, which you create when signed in, stores a snapshot so people can comment.
AI only when you ask
Handing a visual slot to the AI generator stays in your browser until you sign in and run it. That run is the only design step that costs credits.
What the studio does
Pixel-exact Power BI pages
Page presets match Power BI's canvas settings: 16:9 Full HD (1920×1080, Fluent 2 default), 16:9 HD (1280×720, Classic reports), 16:9 HD+ (1600×900, custom size), 16:9 QHD (2560×1440), 4:3 (960×720), 4:3 large (1440×1080, custom size), Letter (816×1056), Tall scrolling page (1920×2160, custom size), Phone portrait 9:16 (720×1280, preview), Mobile (320×568), or a custom size. Elements snap to an 8 px grid and every visual slot shows the X, Y, width and height you enter in Format → General → Properties.
Brand kits and themes
Pick one of the contrast-checked themes or enter your own colours and fonts. Panels, text and the exported theme JSON change together, so the background and the visuals that sit on it stay consistent.
Icons, logos and images
Drop in icons from the built-in Lucide set, your logo or any image. Uploads stay in your browser; nothing is sent to a server.
Visual slots that become real visuals
A visual slot is left out of the background image and becomes an empty visual container in the PBIP export. For a chart Power BI doesn't ship, hand the slot to the AI: the brief carries the slot size and your brand colours.
Generate the charts Power BI doesn’t ship
Built-in visuals fill most slots. For the rest, VizForge AI turns a plain-English brief into a Power BI custom visual (.pbiviz) with its TypeScript source. Select a visual slot in the studio and choose the AI hand-off, or start from a chart type below.
Generate a custom visual with AI · starts free →Guides
Short guides for taking a studio design into Power BI Desktop.
Step by step
Set a background image in Power BICanvas background, Image fit and transparent visuals.
Guide
Background image sizePixel sizes for every page type and why images blur.
Guide
Page and canvas sizeChoosing 16:9, 4:3, Letter or a custom size.
Size picker
Start at a custom page sizeOpen a blank studio page at any Power BI canvas size.
Guide
A theme for the Fluent 2 baseWhat new reports set by default and how a theme overrides it.
Step by step
Import a theme JSONDesign ribbon → Import theme in Desktop, View → Theme pane in the service.
Step by step
Export a page as PBIPFrom this studio to an open .pbip project.
Principles
Dashboard design best practicesLayout, hierarchy, colour and accessibility.