Dark Power BI theme
Aurora Night Power BI theme
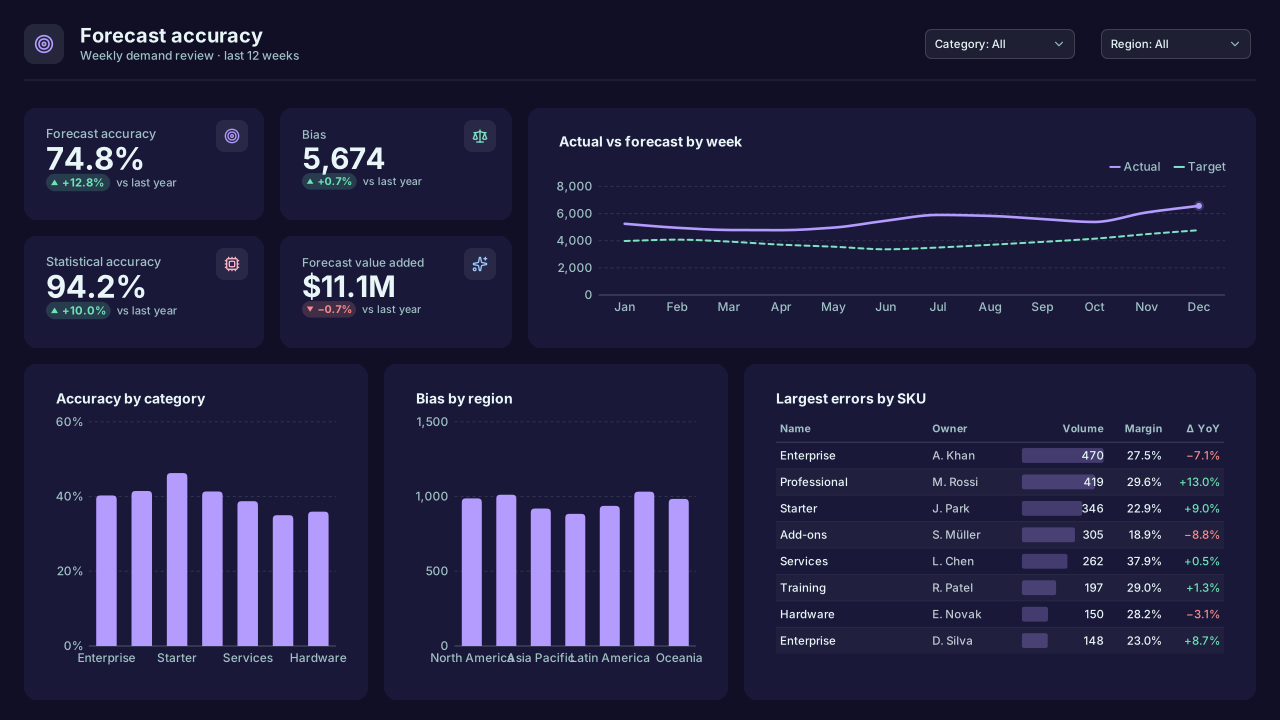
Calm dark Power BI theme: aurora lilac lead on midnight violet, mint, blush and ice-blue series for cloud cost and forecast pages at night.
By Nawaf Sharaf · Founder & Reliability Engineer · Updated
Free for commercial use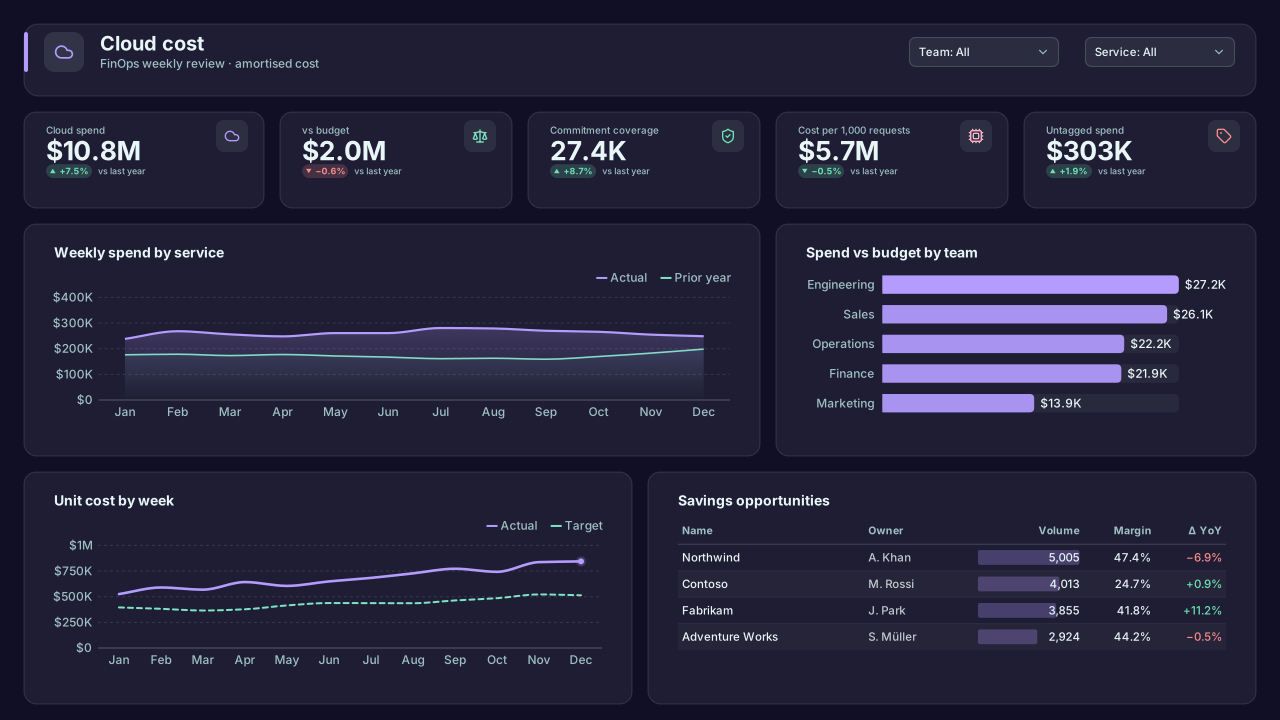
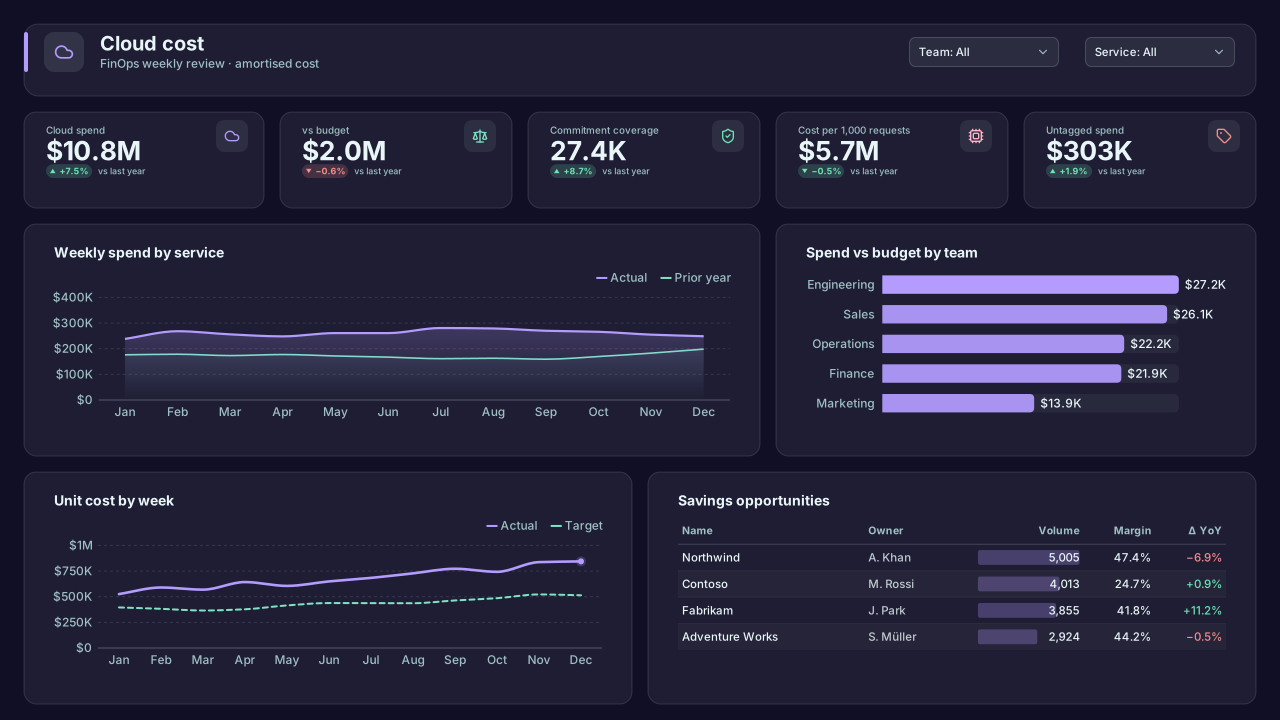
Shown on the Cloud Cost (FinOps) template.
Power BI Desktop: Design ribbon → Import theme. Power BI service: View → Theme pane.
About the palette
Aurora Night is a soft dark theme: midnight-violet page #100F26, cards #191838, and an aurora lilac #B49CFF lead. Mint #7DE3C3, blush #FFB3C7 and ice blue #9CC9FF follow, light tints that glow without the harshness of neon.
It suits cloud-cost, forecast-accuracy and planning pages viewed on dark-mode laptops. Because the series are all light, fills look gentle; use the darker card colour for gaps between bars. Text #E8F6F7 reaches 15.4:1 on the cards.
Palette profile
Computed from the colours on this page, not written by hand: hue spread, lightness range, contrast and a colour-vision simulation of the first six chart colours.
Best for
- Clustered and stacked charts with up to six series (8 hue families); add data labels to the pairs listed below.
- Wall displays and dark-mode screens: text at 15.4:1 and every chart colour at 7.4:1 or more on the cards.
- Variance charts, waterfalls and KPI deltas: good #6CE4B5 and bad #F78C8C are 157° apart in hue.
Colour-vision simulation
- Protanopia: series 2 and 6 (#7DE3C3, #FFCF9E)
- Deuteranopia: series 2 and 3 (#7DE3C3, #FFB3C7); series 5 and 6 (#E6F59A, #FFCF9E)
- Tritanopia: series 2 and 4 (#7DE3C3, #9CC9FF); series 3 and 6 (#FFB3C7, #FFCF9E)
- Give those series data labels or direct labels instead of relying on the legend.
- Chart colours
- 8, in 8 hue families
- Lightness range
- 69–85 %
- Text contrast
- 15.4:1
- Muted text
- 8.7:1
- Weakest chart colour
- 7.4:1 on cards
- Near-grey series
- 0
- Closest catalog palettes
- Indigo Dusk (0.058)Signal Violet (0.070)Risk Desk (0.073)
Colours and contrast
Contrast ratios are measured against the card (surface) colour, where visuals sit. Text needs 4.5:1; graphics need 3:1.
| Role | Colour | Contrast on card | Check |
|---|---|---|---|
| Page background | #100F26 | — | base |
| Card / surface | #191838 | — | base |
| Text | #E8F6F7 | 15.42:1 | AA text |
| Muted text | #9FC0C4 | 8.80:1 | AA text |
| Accent | #B49CFF | 7.44:1 | ≥ 3:1 |
| Good | #6CE4B5 | 10.90:1 | ≥ 3:1 |
| Neutral | #F7D06C | 11.55:1 | ≥ 3:1 |
| Bad | #F78C8C | 7.39:1 | ≥ 3:1 |
| Data colour 1 | #B49CFF | 7.44:1 | ≥ 3:1 |
| Data colour 2 | #7DE3C3 | 11.10:1 | ≥ 3:1 |
| Data colour 3 | #FFB3C7 | 10.19:1 | ≥ 3:1 |
| Data colour 4 | #9CC9FF | 9.94:1 | ≥ 3:1 |
| Data colour 5 | #E6F59A | 14.56:1 | ≥ 3:1 |
| Data colour 6 | #FFCF9E | 11.94:1 | ≥ 3:1 |
| Data colour 7 | #D0A3E8 | 8.21:1 | ≥ 3:1 |
| Data colour 8 | #8FD8E8 | 10.70:1 | ≥ 3:1 |
Theme JSON excerpt
The downloaded file also includes text classes, visual styles and slicer, table and card defaults.
{
  "name": "Aurora Night",
  "dataColors": [
    "#B49CFF",
    "#7DE3C3",
    "#FFB3C7",
    "#9CC9FF",
    "#E6F59A",
    "#FFCF9E",
    "#D0A3E8",
    "#8FD8E8"
  ],
  "background": "#100F26",
  "foreground": "#E8F6F7",
  "tableAccent": "#B49CFF",
  "good": "#6CE4B5",
  "neutral": "#F7D06C",
  "bad": "#F78C8C"
}
Import this theme in Power BI Desktop
- 1
Download the theme
Use the Download theme JSON button above. The file is a few kilobytes and contains no images.
- 2
Import the theme
In Power BI Desktop open the Design ribbon → Import theme and select the file. In the Power BI service use View → Theme pane. Older Desktop builds: View → Themes → Browse for themes.
- 3
Check visual overrides
Visuals with manually set colours keep them. Use Format → Reset to default on those visuals to pick up the theme.
- 4
Add a matching background
Open the design studio with Aurora Night selected to build a page background in the same colours.
VizForge AI · custom visuals
Generate a custom visual for this slot
Need a chart Power BI doesn't have? Pick a slot from the sample report above and VizForge AI writes a custom visual (.pbiviz, with TypeScript source) sized to it and drawn in the Aurora Night colours.
Area chart · 704×200 px
1, 2 or 5 credits depending on the brief · 5 free on signup. Sign in or create a free account on the next screen; the brief is saved for 30 minutes.
A Power BI area visual titled "Weekly spend by service". It sits in a 704×200 px slot on a designed report page. Match the report's brand: data colours #B49CFF, #7DE3C3, #FFB3C7, #9CC9FF, #E6F59A, #FFCF9E; background #191838; text #E8F6F7; font Segoe UI. Transparent visual background so the page design shows through; no visual border. The report uses the Aurora Night Power BI theme.
Templates in this theme
Backgrounds to pair with Aurora Night
Dark page backgrounds that sit well under this palette. Each background page has its own theme download, or keep Aurora Night and set the background image on top.
1280×720 background
Ink Sidebar NavigationDark Power BI background with a left navigation rail for page-navigator buttons, title area and a five-panel layout. VizForge yellow accent.
1280×720 background
Neon WallboardDark wallboard background for Power BI on TVs: six striped KPI tiles, a large trend panel and three bottom panels on near-black. 1920×1080 or 1280×720.
Need a chart Power BI doesn’t ship?
Theme colours apply to custom visuals too. Describe the chart in plain English and VizForge generates it as a .pbiviz with its TypeScript source; in the design studio, the brief for a visual slot carries this palette. See the visual catalog.
Generate a custom visual with AI · starts free →Questions about this theme
Is the Aurora Night theme accessible?
Yes. Text and muted text meet WCAG AA (4.5:1) on both the page and card colours, and every data and status colour reaches at least 3:1 against the cards. In a colour-vision simulation 5 pairs among the first six chart colours look alike; the palette profile lists them so you can add data labels. The full contrast table is on this page.
Which fonts does the Aurora Night theme use?
It uses Segoe UI. All of them are in Power BI's own font list, so the report renders the same in Power BI Desktop and in the Power BI service.
How do I import a theme JSON into Power BI?
In Power BI Desktop go to the Design ribbon → Import theme and select the downloaded .json file; in the Power BI service use View → Theme pane (older Desktop builds: View → Themes → Browse for themes). The data colours, text classes and visual defaults apply to every page of the report.
Which theme JSON schema do these themes use?
They are compiled against the current report theme schema (reportThemeSchema-2.159) and include name, dataColors, background, foreground, tableAccent, good/neutral/bad, textClasses and visualStyles.
Similar themes
- Lilac Haze
Light theme
- Signal Violet
Dark theme
- Chalkboard
Dark theme
- Indigo Dusk
Dark theme
- Forest Night
Dark theme
- Lavender SaaS
Light theme
Keep exploring
80 contrast-checked theme JSON files, light and dark.
Build a theme JSON from your own brand colours.
61 hand-designed Power BI page layouts by department.
Page backgrounds at 1280×720 and 1920×1080 with visual positions.
Design a page in Aurora Night
Start the design studio with this palette, lay out your page and export a background, the theme JSON and a PBIP project that all match.
The design studio for Power BI. Free, in your browser, no sign-up.