VizForge team · Staff pick
Warehouse Stock Health — Tabbed header
by VizForge team · 5 Nov 2026
For an inventory planner: which categories are running thin, which are tying up cash and the short list of SKUs to act on today. Drawn with a title bar with page tabs, flat panels and compact spacing, in the Paper White theme.
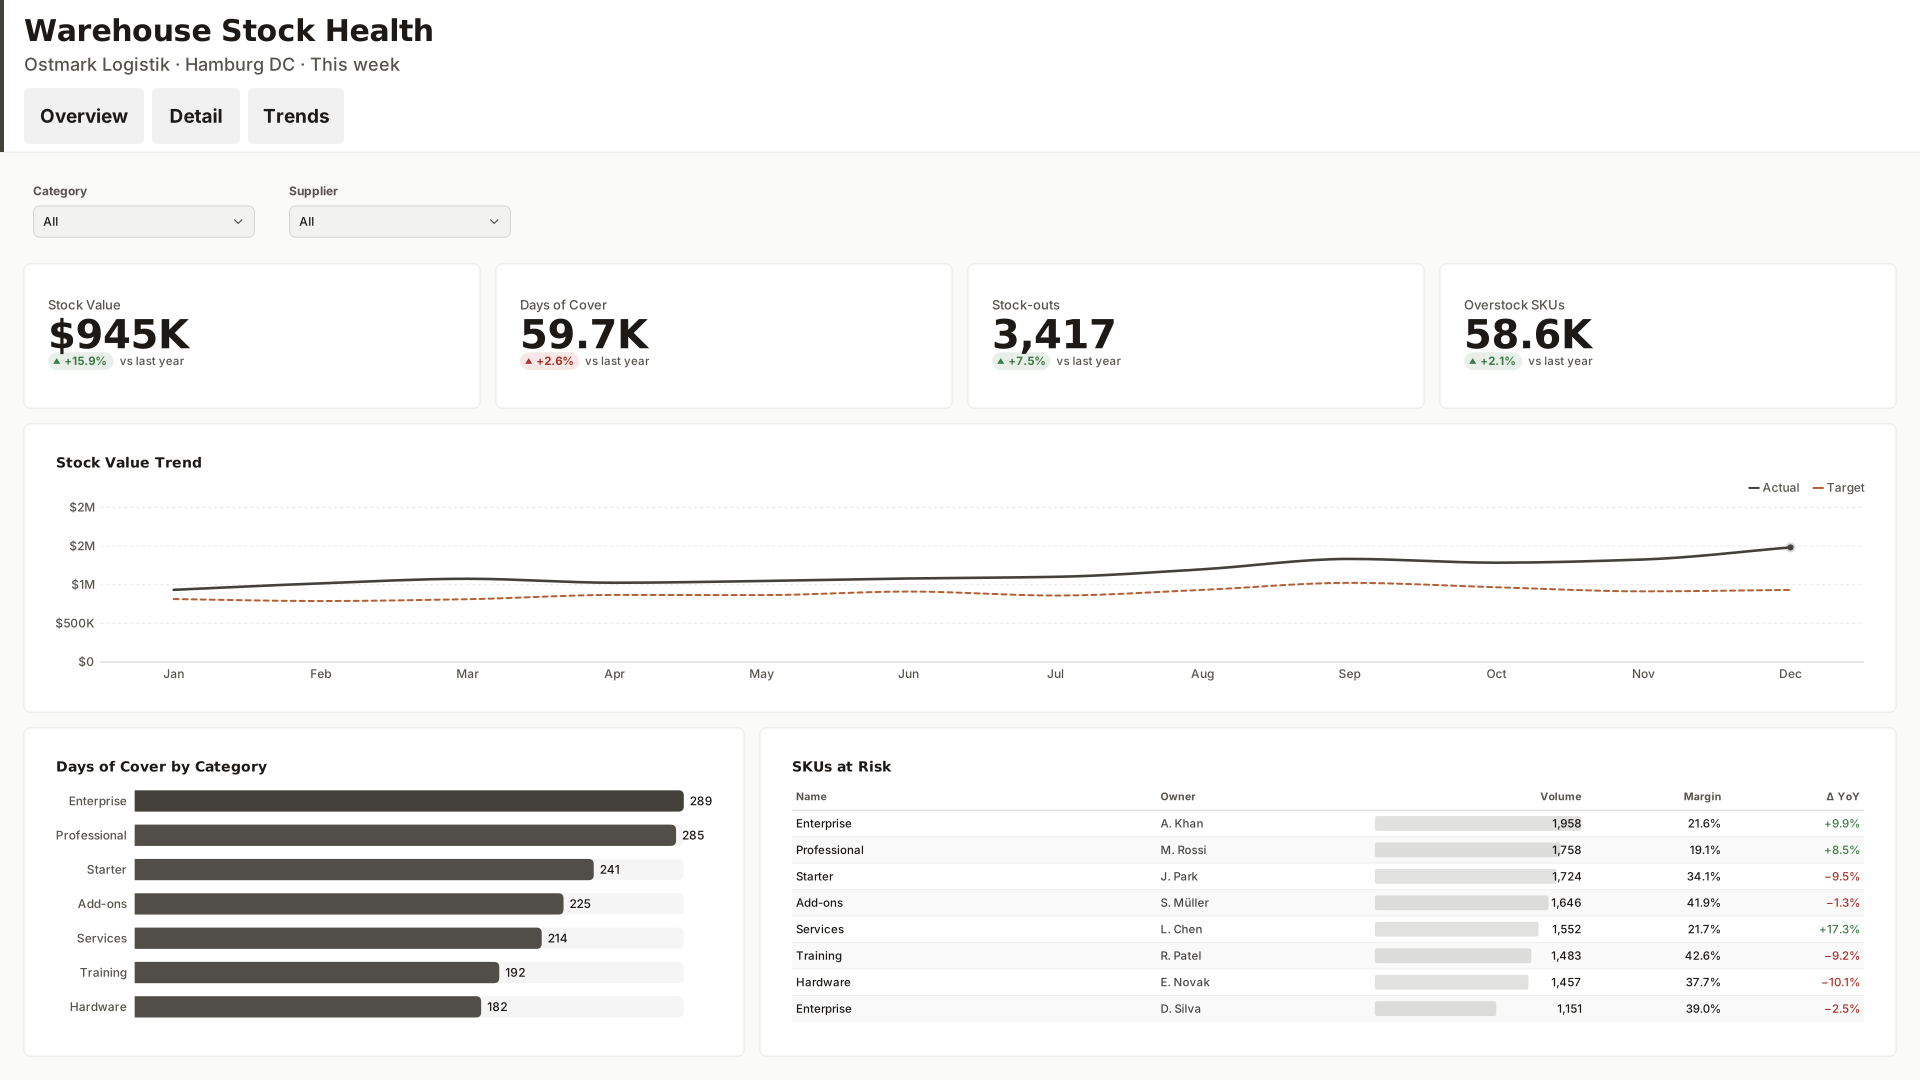
Built in your browser. The PBIP carries sample data: the template’s own model when the design started from a template (visuals whose titles match the template’s are bound; the rest export empty, ready for your fields), otherwise the generic sales and operations model with every built-in visual bound by its kind and title. Downloads carry a small “Made with VizForge” mark.
Who the page is for
Ostmark Logistik is a fictional company, so the figures in the preview are placeholders; the titles, layout and colours are what this design contributes.
The layout uses a title bar with page tabs, flat panels and compact spacing. The 4 KPI cards read Stock Value, Days of Cover, Stock-outs and Overstock SKUs. Below them sit Stock Value Trend (line chart), Days of Cover by Category (bar chart) and SKUs at Risk (table). Filters: Category and Supplier.
What’s on the page
Read from the design file itself, so it always matches the download.
- Page size
- 1920×1080 px
- KPI cards
- Stock Value, Days of Cover, Stock-outs and Overstock SKUs
- Charts
- Stock Value Trend, Days of Cover by Category and SKUs at Risk
- Slicers
- Category and Supplier
- Pages
- Overview, Detail and Trends
Design Check: 100/100
The same deterministic check the Design Studio runs. 85 or more, with every text box at WCAG AA contrast, passes the community quality gate.
| Check | Points | Result |
|---|---|---|
| Grid and alignment | 20/20 | Every visual slot and card panel is on the 8px grid, inside the page and clear of its neighbours. |
| Gutters | 15/15 | All 4 gutters between panels match (16px across). |
| Text contrast | 25/25 | All 5 text boxes meet WCAG AA contrast against the background actually behind them. |
| Minimum text size | 15/15 | All text is at least 13.5px, legible when Power BI fits a 1920 × 1080 page to a laptop screen. |
| Colours vs theme | 10/10 | Every colour on the page comes from the theme or a tint of it. |
| Font families | 5/5 | 2 font families (Segoe UI Semibold, Segoe UI): a heading and a body face is plenty. |
| KPI density | 10/10 | 4 KPI cards, each at least 168 × 84px: room for a value, a label and a comparison. |
Remixes
Approved remixes of this design. Remix it yourself and publish the result from My designs.
No published remixes yet.
Related designs
More by the VizForge team: other layouts for Ostmark Logistik, then designs for other companies.
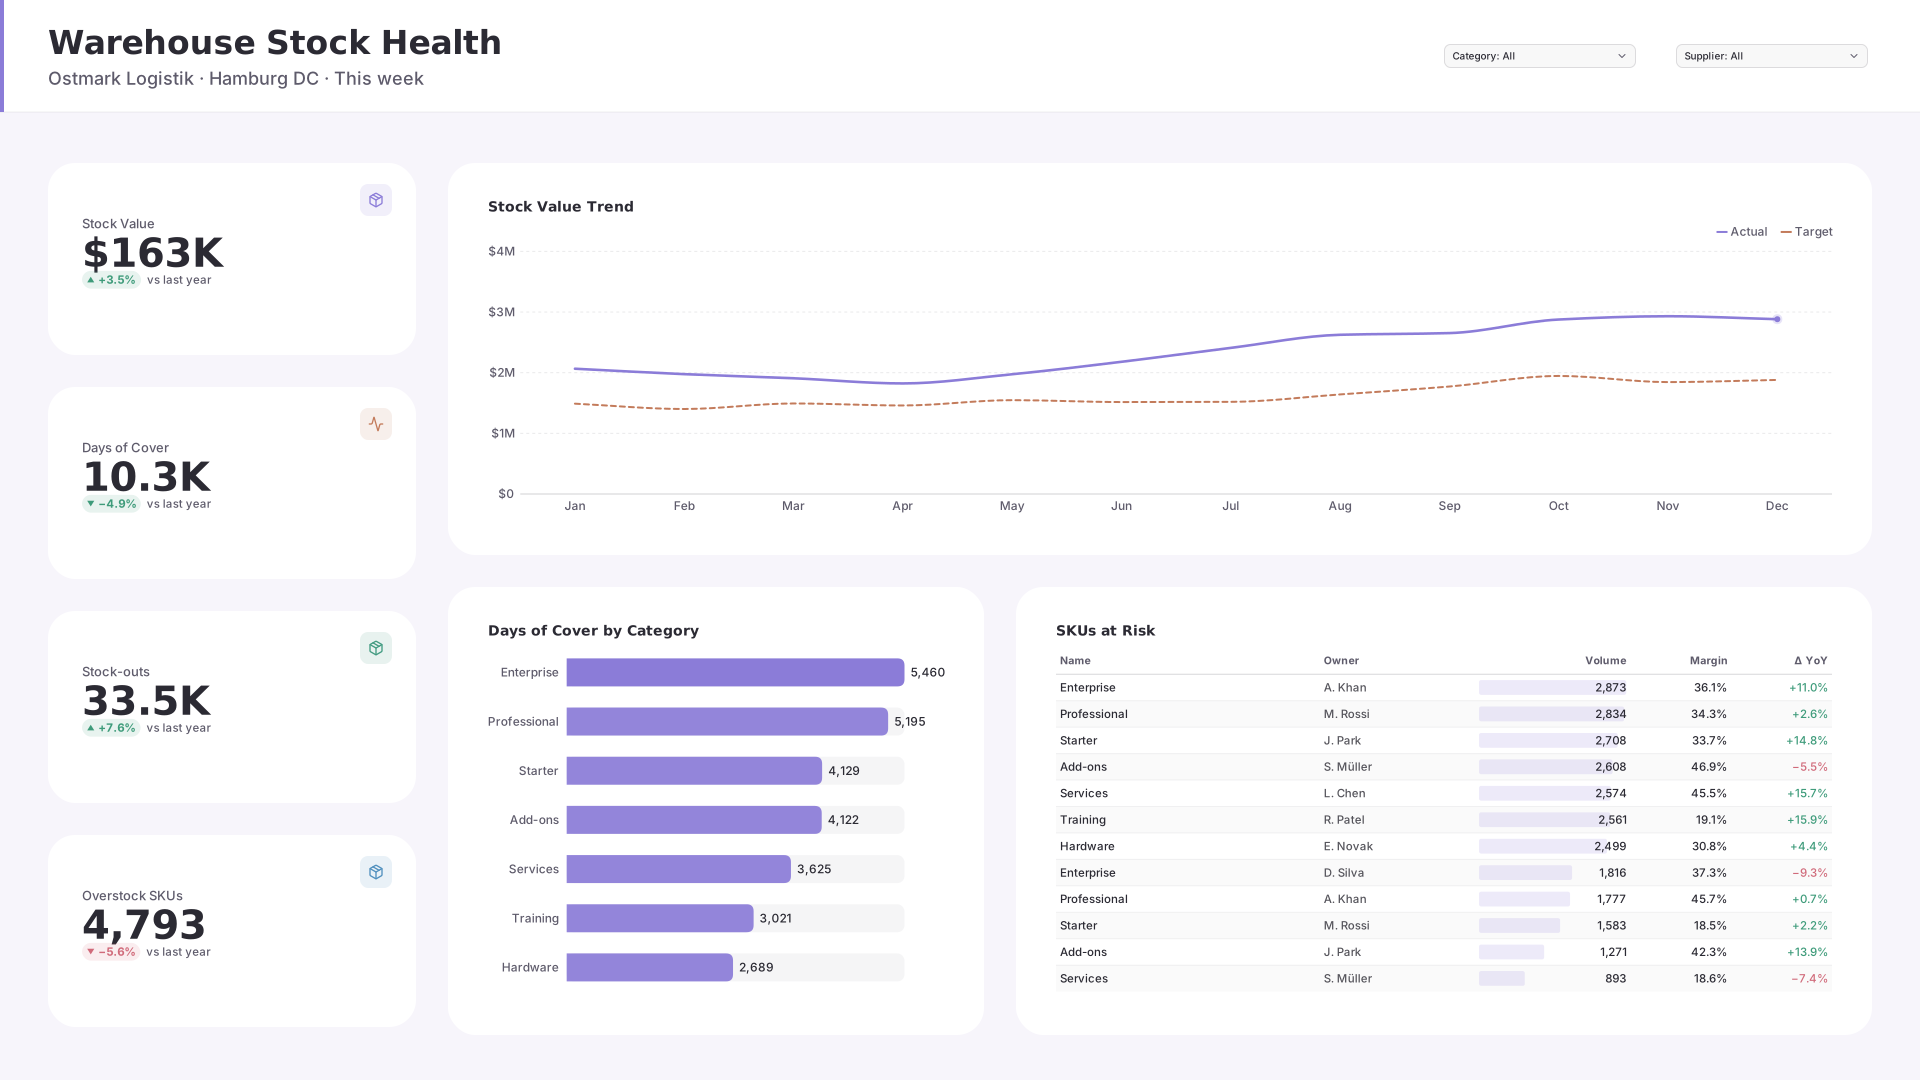 VizForge team · Staff pick
Warehouse Stock Health — KPI column
by VizForge team · 1920×1080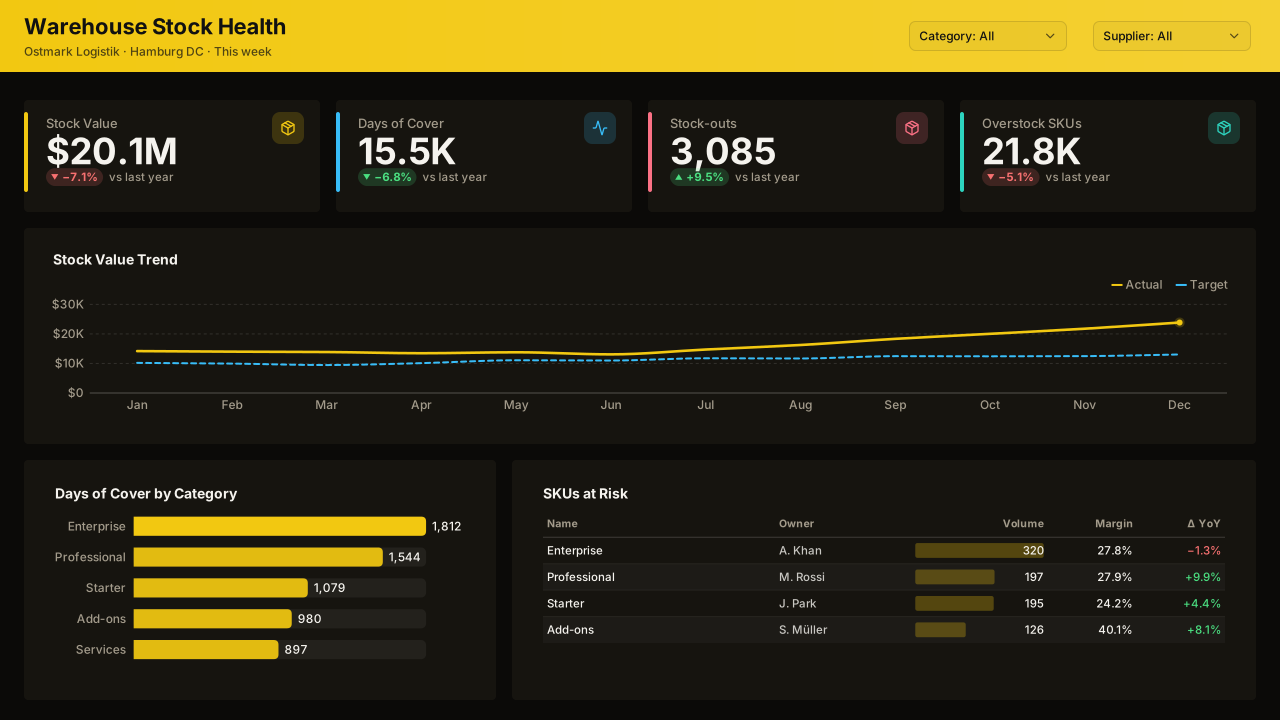 VizForge team · Staff pick
Warehouse Stock Health — Classic 1280
by VizForge team · 1280×720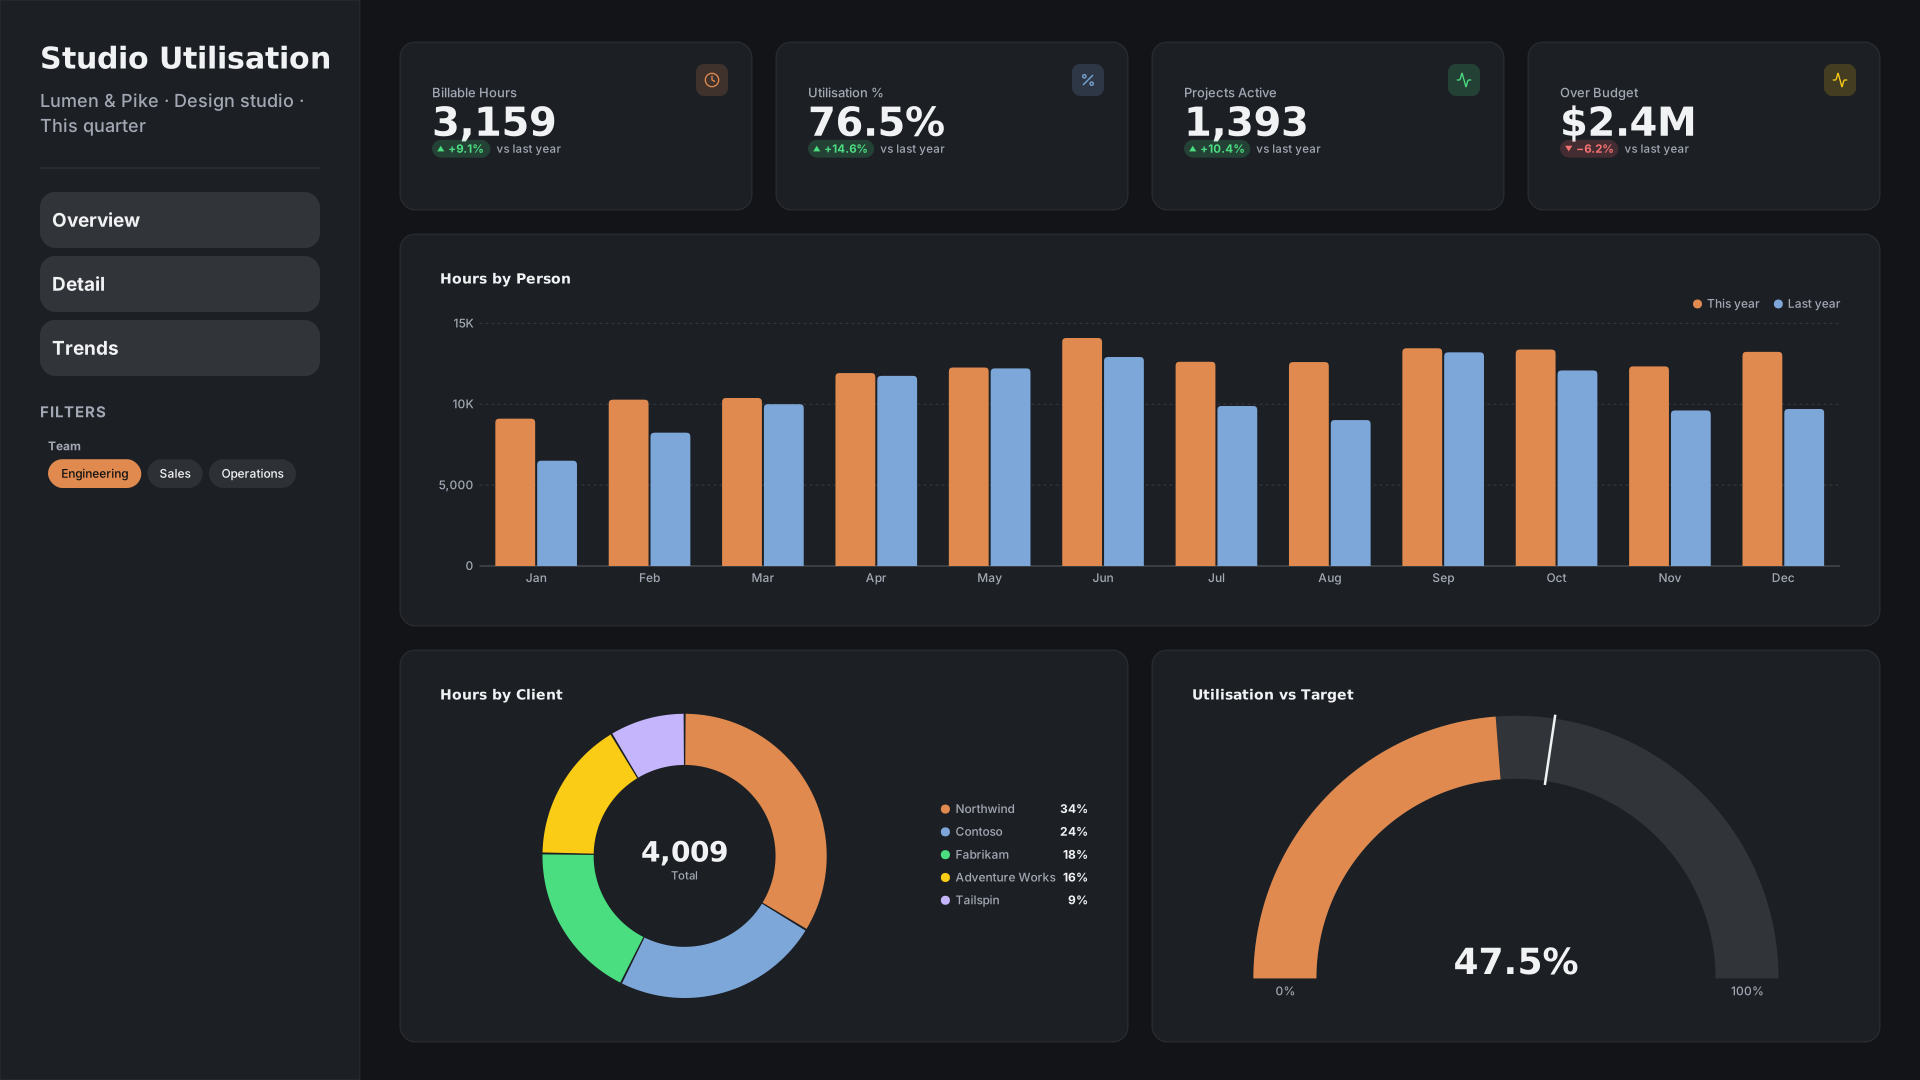 VizForge team · Staff pick
Studio Utilisation — Wide sidebar
by VizForge team · 1920×1080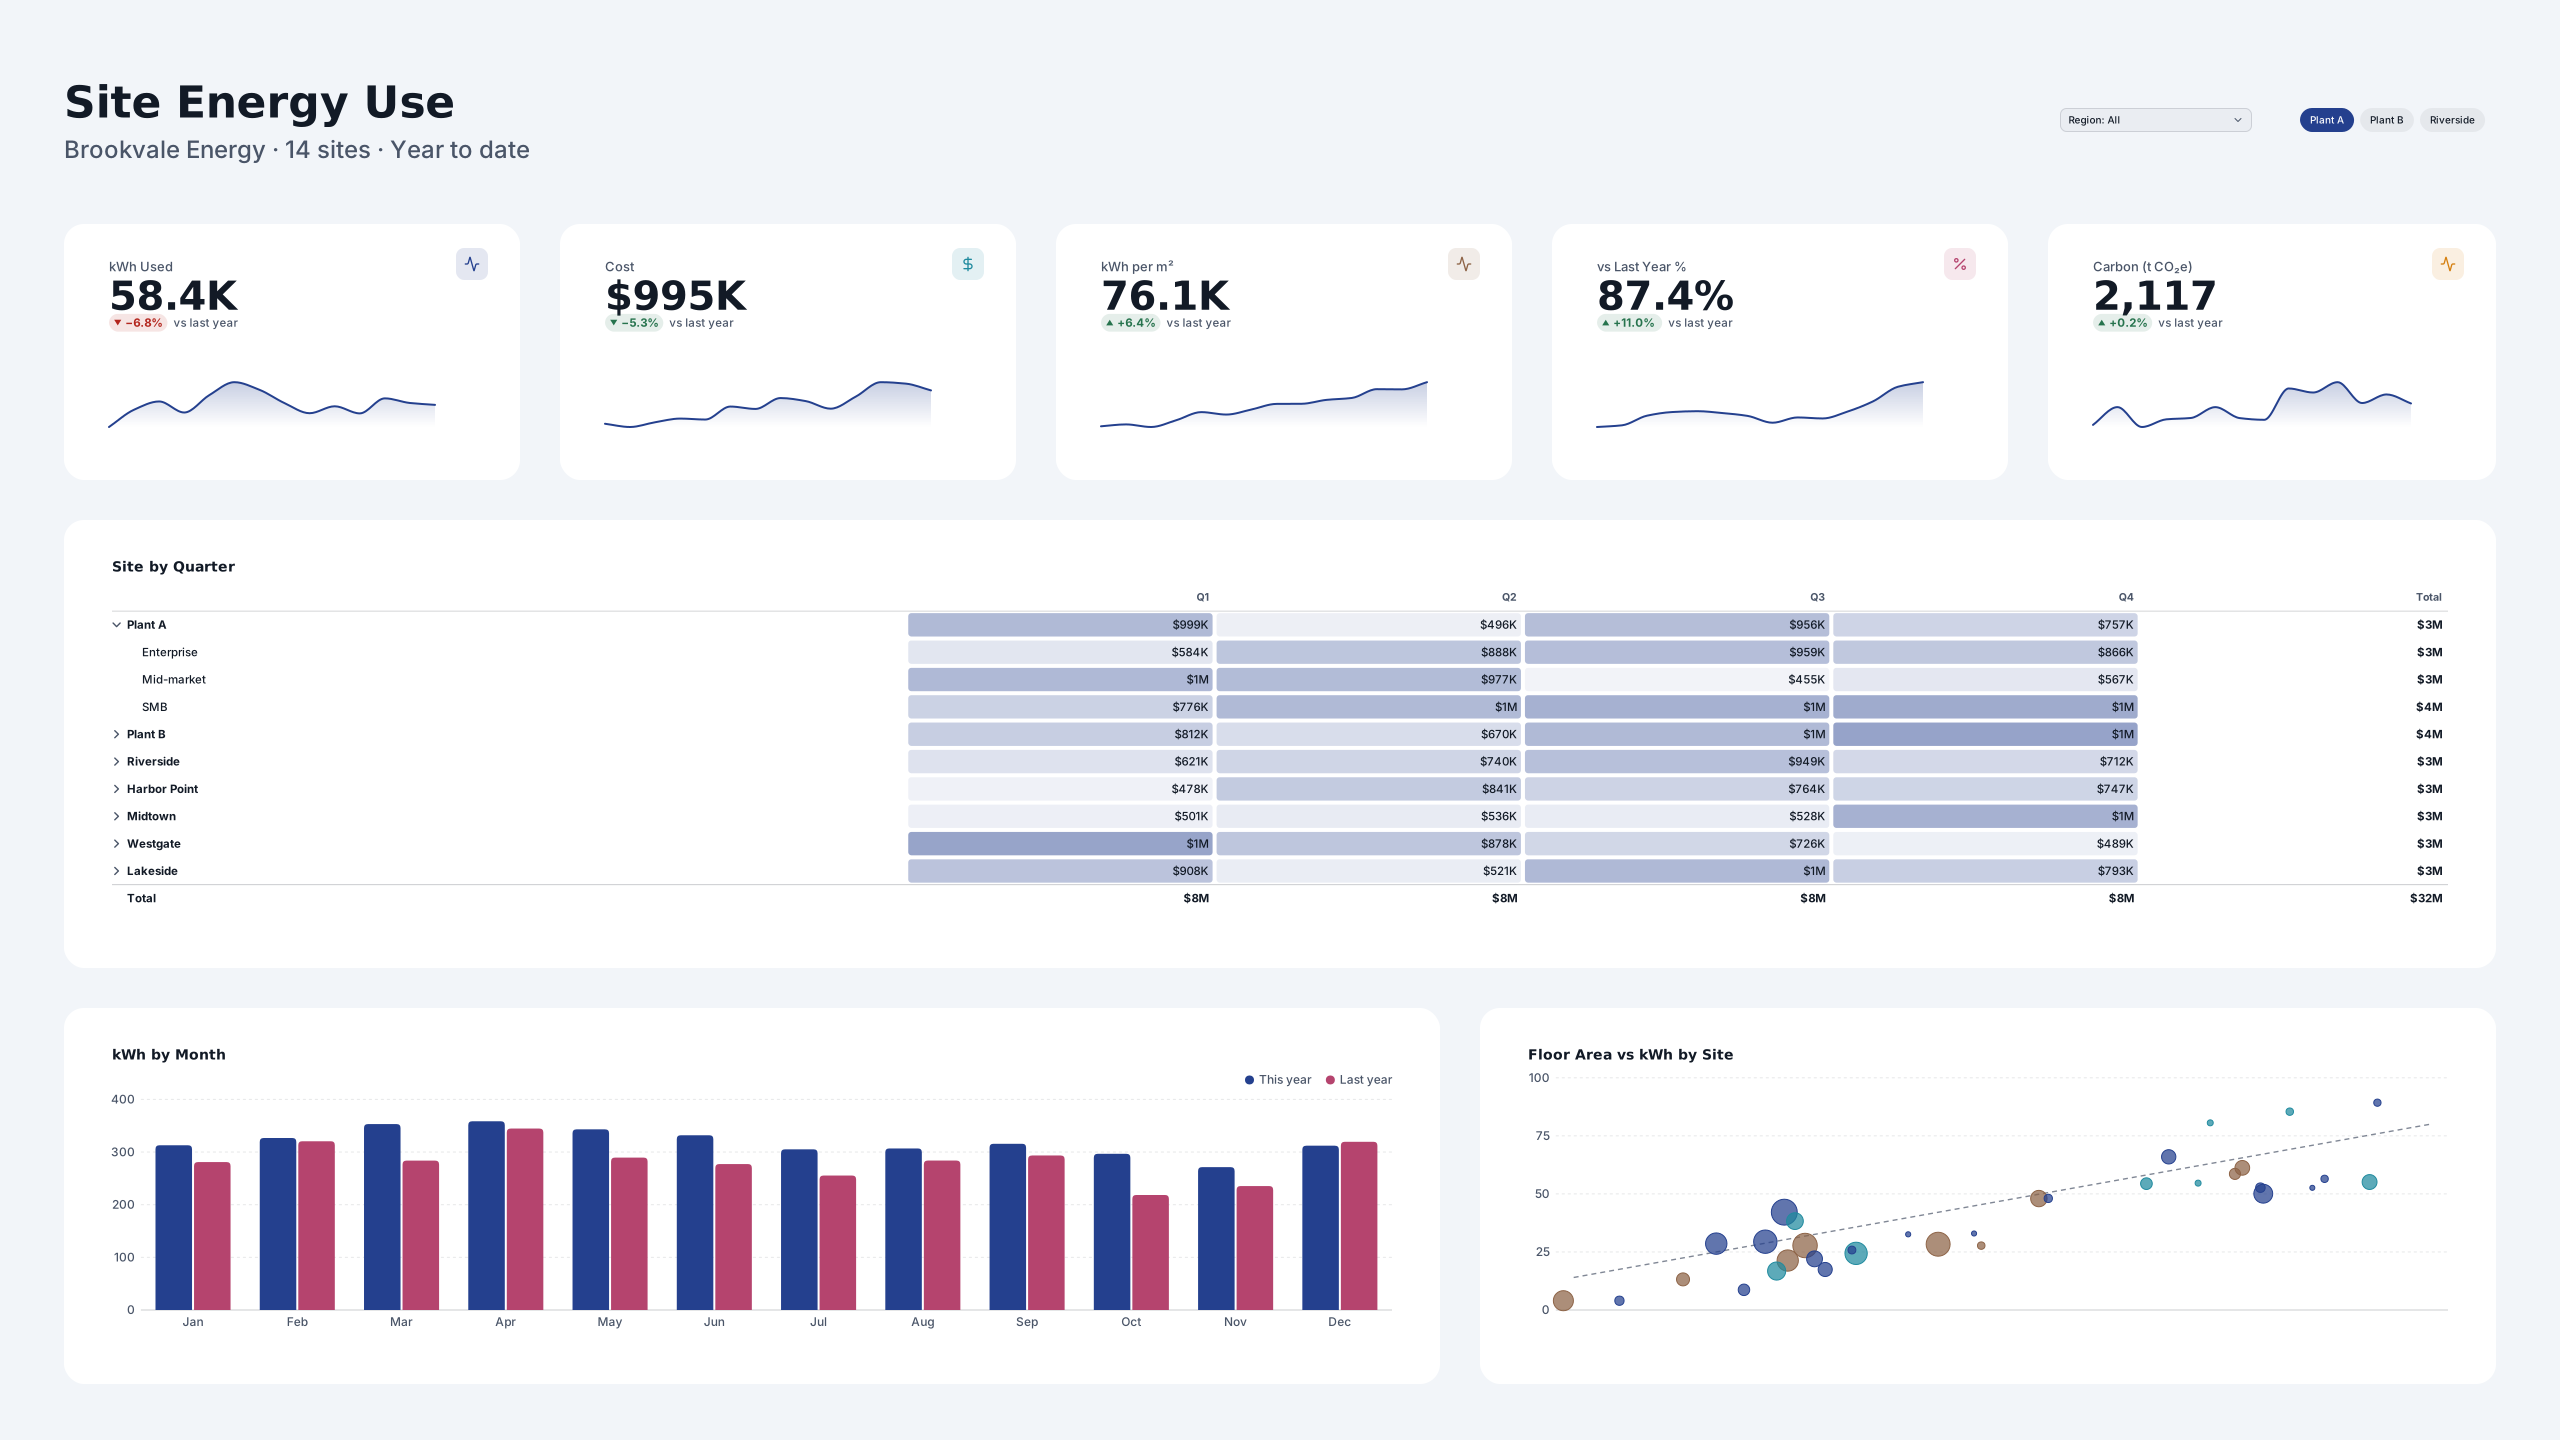 VizForge team · Staff pick
Site Energy Use — Wall screen
by VizForge team · 2560×1440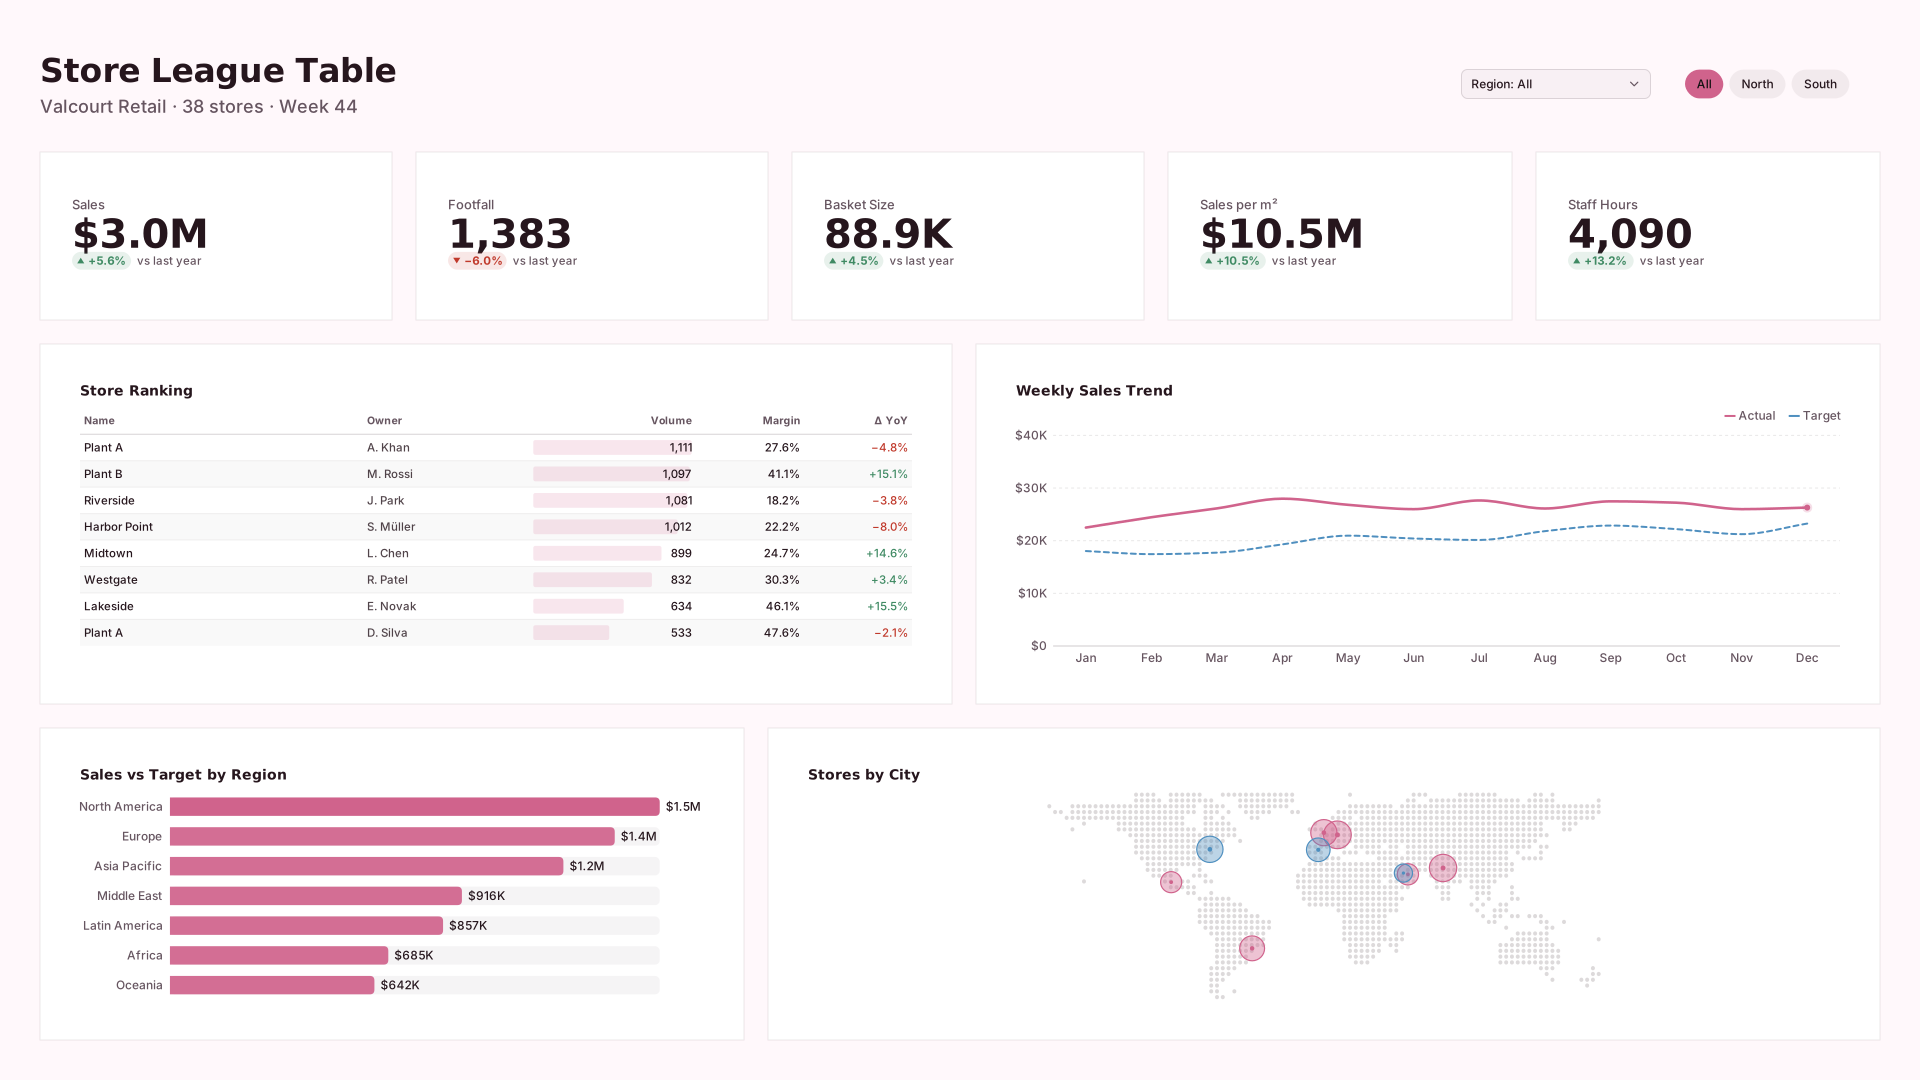 VizForge team · Staff pick
Store League Table — Flat minimal
by VizForge team · 1920×1080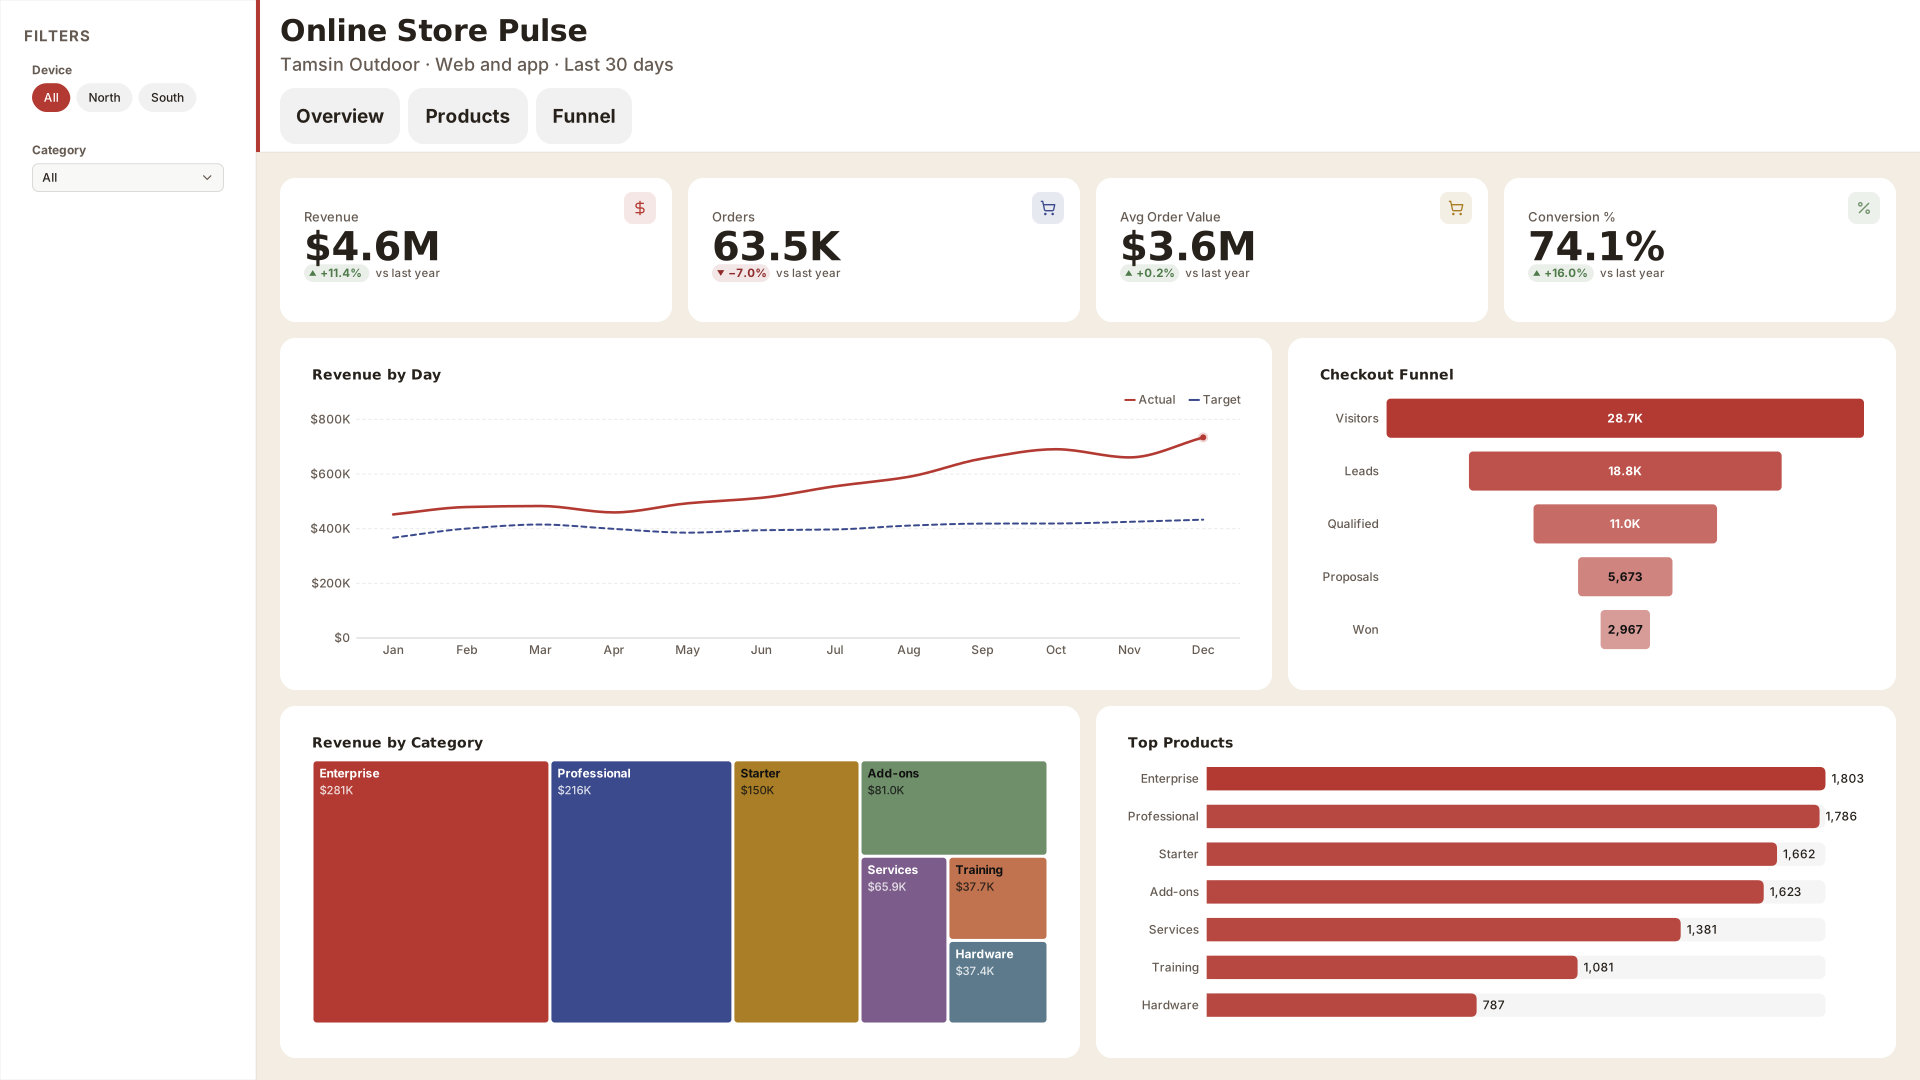 VizForge team · Staff pick
Online Store Pulse — Compact nav
by VizForge team · 1920×1080
- Supply Chain Inventory template covers the same department with its own sample model.
- All community designs
- Design challenges
- Power BI dashboard templates
- Licence for VizForge design assets (team designs are free for commercial and client use).
Made by the VizForge team with the Design Studio. Report this design