Light Power BI background · 1280×720
High Contrast Outline
Accessible Power BI background: white page, 2px dark panel outlines and generous spacing for high-contrast and low-vision friendly reports.
By Nawaf Sharaf · Founder & Reliability Engineer · Updated
Free for commercial use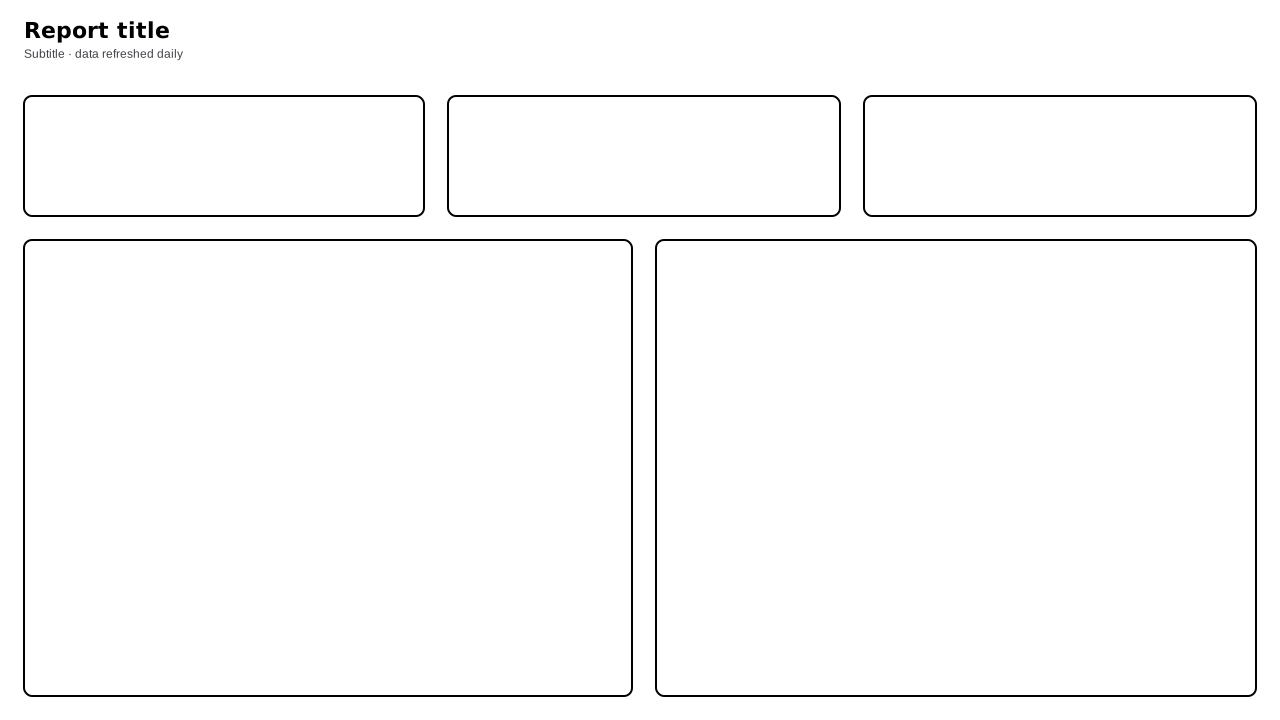
Free, no sign-up. 1920×1080 fits a new page in a Fluent 2 report; 1280×720 and 2× fit Classic pages. Downloads include a small “Made with VizForge” mark; sign in to the studio to remove it.
About this background
Designed for accessibility reviews: pure white page, panels outlined with 2px near-black borders (well above the 3:1 non-text contrast requirement) and 24px gutters so visuals never crowd each other.
Fewer, larger panels (three KPIs and two large charts) suit readers who zoom. Combine with the High Contrast Light theme and turn on data labels instead of relying on colour alone.
Power BI also has built-in high-contrast modes that follow Windows settings; a background image doesn't change with them, so this design keeps contrast high by default.
Where to place your visuals
Page pixels. In Power BI select a visual, open Format → General → Properties → Size and position and enter these values (inset by 16px for padding).
| Visual | X | Y | Width | Height |
|---|---|---|---|---|
| KPI tile 1 | 24 | 96 | 400 | 120 |
| KPI tile 2 | 448 | 96 | 392 | 120 |
| KPI tile 3 | 864 | 96 | 392 | 120 |
| Main chart 1 | 24 | 240 | 608 | 456 |
| Main chart 2 | 656 | 240 | 600 | 456 |
VizForge AI · custom visuals
Generate a custom visual for this slot
Pick a panel and VizForge AI writes a custom visual (.pbiviz, with TypeScript source) sized to it, in this background's colours, with a transparent background so the panel shows through.
Panel at 24, 240 · 608×456 px
1, 2 or 5 credits depending on the brief · 5 free on signup. Sign in or create a free account on the next screen; the brief is saved for 30 minutes.
A Power BI custom visual titled "Main chart 1". It sits in a 608×456 px slot on a designed report page. Match the report's brand: data colours #0033CC, #CC0000, #007A33, #E07000, #6A1B9A, #007C91; background #FFFFFF; text #000000; font Arial. Transparent visual background so the page design shows through; no visual border. It sits on a panel of the High Contrast Outline page background.
Matching theme
The Theme JSON button above downloads this palette.
Set this background in Power BI Desktop
- 1
Download the PNG
Take the 1920×1080 PNG for a new page in a Fluent 2 report, or the 2× PNG (2560×1440) for crisp edges on a 1280×720 Classic page.
- 2
Open Canvas background
Select the page, then Format page → Canvas background → Browse, and pick the file.
- 3
Fill, 0% transparency
Set Image fit to Fill and transparency to 0% so the panels line up with the page grid.
- 4
Place visuals on the panels
Turn off each visual's background and border, then use the positions above.
Other themes for this background
Other light themes that work on this background. Download the theme JSON from its page and import it after setting the background image.
Light theme
Civic SlateAccessible light Power BI theme for government and public-sector reports: navy lead, burnt orange and teal series, dark text and plain Segoe UI.
Light theme
Solar FieldLight energy Power BI theme for solar and renewables: amber lead on a warm white page, teal and leaf-green series, rust for losses, Bahnschrift headings.
Need a chart Power BI doesn’t ship?
Describe it in plain English and VizForge generates a custom visual as a .pbiviz file, with its TypeScript source. In the design studio, hand any visual slot to the AI and the brief carries the slot size and your brand colours. Sankey, Gantt, bullet, waterfall and more: see the visual catalog.
Generate a custom visual with AI · starts free →Questions about this background
What size is the High Contrast Outline background?
It is designed on a 1280×720 pixel Power BI page (the Classic report size) and downloads at 1280×720, at 1920×1080 for a new page in a Fluent 2 report, and at 2× (2560×1440) for sharper edges on high-resolution screens.
Where do I place my visuals on this background?
Use the 5 panel positions in the table on this page. Inset each visual by about 16 pixels inside its panel so rounded corners and shadows stay visible.
How do I set a background image in Power BI?
Select the page, then in Format page → Canvas background choose Browse, pick the image, set Image fit to Fill and transparency to 0%. In theme JSON the labels differ: JSON “Fill” is UI Fill, JSON “Fit” is UI Stretch and JSON “Normal” is UI Fit.
Why do my visuals hide the background panels?
Visuals have their own background and border turned on by default. Turn off Format → General → Effects → Background and Visual border for each visual, or apply the matching theme JSON, which does it for you.
More backgrounds
Keep exploring
Page backgrounds at 1280×720 and 1920×1080 with visual positions.
61 hand-designed Power BI page layouts by department.
80 contrast-checked theme JSON files, light and dark.
3,034 icons in 40 categories as SVG, PNG, DAX or theme icon JSON.
Make a background that fits your report
Draw panels, header bands and navigation rails on the Power BI grid in the design studio, add your logo, and export at 1× or 2×.
The design studio for Power BI. Free, in your browser, no sign-up.